What a dogfight this has turned out to be with EURUSD. I feel like entering a trade now would be like betting on one of two heavyweight boxers in the fight of the century. Someone will lose, soemone will win, there is no in between. I'm betting on Shorty Shortheimer to come out victorious because Longy Longrunner is running out of steam and doesn't have the chin to hold out much longer. 😆
You are using an out of date browser. It may not display this or other websites correctly.
You should upgrade or use an alternative browser.
You should upgrade or use an alternative browser.
Advanced Structured Forex Trading
- Thread starter 7thSignalTrader
- Start date
- Watchers 60
7thSignalTrader
Well-known member
- Messages
- 351
- Likes
- 7
soccer_daemon said:Hi 7th,
I think I am not the only one who feels that my "timing" on this inevitable Short is
a long way off. In fact mine went back to Thu last week, which is one whole
trading week .... 8-(.
I suspect your system would have sensed the shift in the timing of the short call
since some time last week & continue to do so coming into this week ? This
is an important lesson on the "timing" aspect and hopefully u can share some
insights in how it relates to tcds etc.
Thanks
SD
Hello SD,
Do you see the Outlook Trade profile target and its associated signal and its stated time-frame for when that trade would be initiated and when it normally terminates each month? (see first post in this thread) All that happened here, is that a Swing Trade profile in opposition to the Outlook Trade profile was initiated near the end of the month and about 182 pips away from the Outlook Trade profile target.
So, you get an Outlook Trade profile fighting against the Swing Trade profile near the end of the month and this time, the Outlook won the battle. So, I’m happy either way but would rather have seen this Swing Trade profile turn towards its target this week in stead of next week because that forces me into a longer hold period and I don’t like long hold periods that go outside the range of the profile’s time-frame.
If I’m in a Day Trade profile, then I don’t mind holding for 24hrs. If I’m in a Swing Trade profile, then I don’t mind holding for 5 trading days. And, if I’m in an Outlook Trade profile, then I don’t mind holding for 22 trading days which is one full month. Every profile has its “Time” and “Place” in this system and when a larger (BIGGER) signal runs up against a smaller signal, then the differential between the two profiles becomes the total (absolutely value) of the risk that I take.
Now, four (4) things to keep in mind:
1) It will be really, really difficult for those who don’t even know what a TCD is to fully understand what’s going on. For those that don’t know what a TCD is or means, you will know between now and somewhere around May 1st, 2006 (+/- a couple days).
2) Go back and review the Dashboard’s posted to date in this thread and look at the results of all the Swing Trade Profiles when it was against the Outlook Trade Profile. That will help you understand the risk taken on this particular trade.
3) A tradable instrument reaches new trading levels in one of two (2) ways and only one of two (2) ways.
4) You have to define what a “trade” means to you and realize the potential boundary layer for that trade.
Numbers 2 and 3 above are pretty self explanatory, so I’ll conclude with numbers 3 and 4 before I head out to the airport today.
Any honest look at the historical data of this particular pair from a technical standpoint using the weekly bar of data for the past 7 years will reveal that this week has entered a technical anomaly. No one who pays attention to EURUSD market data can read the data over the years and concluded that this week is somehow “normative” or behaviorally congruent with the historical norms. A few times a year, you can expect these types of news driven anomalies to line up seemingly perfectly for the label of “trend” in the minds of trend seekers.
Go back and look at the data for every single week dating back to 12/27/04, as just a small example of what the norm is on a weekly basis for the EURUSD. What do you see? What you see is the movement of price from week-to-week that accompanies a routine cyclical nature between the previous week’s high and the current week’s low. That’s a fact that history shows simply by analyzing the data. You will see this fact being returned year after year after year.
Go back and take a look at the period from 8/30/04 through 11/29/04. What do you see? You see a 14 week bull market. But, are all bull markets the same? To the un-initiated they are. The reality is that there are always two ways in which a pair will get to a new trading level. It will either get there under normative bull/bear market price behavior, or anomalistic bull/bear market behavior. A simple honest look at the weekly data over the many years of existence in the eurusd using the primary tool of the TCD reveals clearly what normative and anomalistic means.
In normative bull/bear markets (using TCDs) you clearly have cyclical price behavior between the weekly previous high and the weekly current low that clearly warrant a Swing Trade coming off of a week in the opposite direction. In anomalistic bull/bear markets (using TCDs) you clearly have non-cyclical price behavior between the weekly previous high and the weekly current low. Simple.
Now, review the past two weeks price behavior against the true historical nature of weekly EURUSD data using TCDs. What do you see? You clearly anomalistic non-normative price behavior between last week’s high/low and this week’s high/low. Again, simple.
Now, that only leaves the question of what caused it and that answer is equally as simple using 20/20 hindsight, of course. One word: News. How do you know for sure? Two (2) things stand out as being crystal clear to those who understand and use TCDs:
A) Go review this week’s daily TCD action within last week’s AND this week’s TCD action. What do you see?
On every single trading day this week, you see a strong attempt in the pair to (and this is very important) return to the Weekly TCD Shor. Look at a 1 hour chart from Sunday through Today and you will clearly see this. Why is this important? It shows the underlying normative tendency of the TCD to always want to seek its normal range. So, all throughout the week, you had the EURUSD trying hard to get back inline with its own historical and natural tendency.
B) Upon each attempt to return to its normal historical tendency (normative behavior) there was a news vector in opposition and directly inline with the Outlook Trade profile – almost as if by design. I have some thoughts on why this happens, but I don’t discuss them publicly as I expect them to be a part of the system’s design in the future.
So, on every day this week with the possible exception of 4/25/06, the sell-off was initiated and then halted on anticipation of news, or flat out reversed on the anti-USD/pro-EUR news. That sums up what happened this week.
Why don’t you see me panicking and overly concerned with this trade? That’s simple, too. It is because I understand what my definition of a “trade” looks like. The “trade” was defined back on Sunday/Monday of this week as a Swing Trade. By definition then, that automatically means higher potential profit, higher potential draw-down, higher potential risk due to higher market exposure to possible adverse news pushing the trade into an anomalistic short-term phase. So, because I understand the nature of the trade I have accepted and the potential dynamics of such a trade and everything that has happened to date fits within the possible realm of expected outcomes that I am comfortable with – I have no need to panic and many have demonstrated already this week.
However, my calmness is mostly due to the Monthly Short TCD that will get underway on May 1st, 2006 and because when I study the history of the EURUSD, I see that these anomalistic new price level moves are typically broken sooner, rather than later. Remember, others are looking at trends – I’m looking at TCDs. Eventually, if you trade long enough you will run into these anomalistic fluky news driven phases where “trends” look more real than they are.
The most dominant (by far) form of price movement in the currency market is the TCD, not the trend. The “Timing” of this particular trade gets amplified and morphed whenever it runs into fluky inline news that pushes an anomalistic event in the Weekly bar – which is a much bigger bar than the routine Daily bar that I always trade. If this had been on Outlook Trade, then I would expect such fluky behavior to generate an even BIGGER drawdown.
In either case: Day, Swing or Outlook profile – the return to normative behavior should match the Magnitude of the bar in which the trade was executed. So, a Swing return to normative will be bigger than a Day return to normative, etc.
It is all about the Bar being used and the size of the TCD that is or out of phase. Right now, (and this is also important) I’m inside a Weekly TCD out of phase, but it is running directly into a new Monthly TCD that will be in phase.
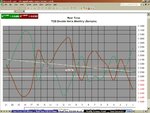
So, I’m expected the Monthly Short TCD to more than make up for the out of phase Weekly Short TCD which could easily extend this trade out a couple more weeks to allow enough time for the Monthly Short TCD to initiate and mature. Below is a pic of the Monthly Real-Time TCD DH chart. It shows you why I am waiting patiently and why I can afford to wait patiently. 😉
Hope this helps, SD. Good questions!
Attachments
7thSignalTrader
Well-known member
- Messages
- 351
- Likes
- 7
mburdge said:There's a lot of 'talk' on both sides.
why not put a stop to the slanging matches and place some actual trade calls?
7th: You seem to be predicting a fall in EUR/USD, but can you state whether you have actual trades in place based on your dshboard.
Forex is a very simple business to judge success or failure of an individual or system. - you place trades and they either win or lose.
So why not stop the specualtion and clearly state some of your live trades here so we can make a simple judgement on how good the system is?
Every trade place here has been live and in real-time with periodic updates and observations. I don't see anyone anywhere offering this level of detail in their trades.
To get up to speed, I would suggest reading the first post in the journal. That will help you understand what trades look like in this particular journal.
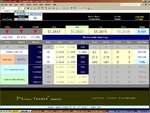
You won't find hand-typed trade calls as this is a digital trade journal. The first post in this journal explains how things work here. The Dashboard "is" the trade and it contains more information than a hand-typed trade call. It is clearer than hand-typed trade calls because it shows you:
1) The Signal
2) The Signal's Strength Indicator (in % form below it)
3) Trade Profiles in full detail with Entry, Limit and Stop (if applicable)
4) Pip performance for each detailed trade profile
5) Other real-time Performance Indicators that don't need explaining here
A big red arrow or a big green arrow is pretty hard to misunderstand. The words "Entry", "Limit" and "Stop", are also pretty difficult to misunderstand. The big number used for the Entry, Limit and Stop, are again pretty difficult to miss as well.
Most people looking at the Dashboard can figure things out because of the huge fonts used and the color of the two possible arrows.
Example:
Giant Red Arrow means: "Short"
Giant Green Arrow means: "Long"
Example:
The word "Entry” and a price directly below it such as “$1.2471” means Enter at $1.2471.
The Session Starts and Session Ends labels in the upper section of the Dashboard only apply to Day Trades as those are the most frequent type of trades that I make. I'm only making this Swing Trade because I've been too busy this week with other things to be involved in the day-to-day observation of Day Trades this week.
The only parts of the Dashboard that one would need to be concerned about are those spell out in the first post of this journal. I used big fonts where appropriate and lots of color and big wide spacing, so reading the Dashboard could be as easy a possible. If you can read a hand-typed trade call, then reading this Dashboard should be fairly uncomplicated.
Last edited:
7th....are you ever gonna "pony up" to your faults?
"the next hours and days will bring about a massive....." well now, all i saw was another 150pip rise in the euro....but of course, there is no fault on your part, the system is perfect, and the draw down "expected", come on brother, any time another trade has experienced a 200pip draw down, you have been all over it like white on rice....but when it happens to you....it is labeled a "swing trade" which is simply being "extended"...wow....fess up to mistakes, it may earn you what little chance at respect you have left.....
so, in conclusion, your system is running prefectly, but missed an entry by 200pips....hmmm...sounds perfect to me! and now you are talking about extending the trade even longer....geez.....we should be experiencing one of the largest corrections in your opinion...hasn't come yet...what a surprise!
will it? of course, we have some solid resistance up ahead...no TCD's needed to see that...and a risk/reward trade that puts your system to shame...so as you break even, hopefully, on your trade, i will pocket a cool 200pips and i owe it all to trading against your swing signal...good stuff!
7thSignalTrader
Well-known member
- Messages
- 351
- Likes
- 7
Brabed said:What a dogfight this has turned out to be with EURUSD. I feel like entering a trade now would be like betting on one of two heavyweight boxers in the fight of the century. Someone will lose, soemone will win, there is no in between. I'm betting on Shorty Shortheimer to come out victorious because Longy Longrunner is running out of steam and doesn't have the chin to hold out much longer. 😆
If you have those daily, weekly and monthly TCD values set-up and did not approach a Swing Trade profile with a Day Trade or Scalpers mental image of outcome, then things will work out just fine to break-even or better.
I’ve got to cut this reply short and get over to the airport right now, but to put this into perspective for those who understand TCDs, the Weekly TCD Short for next week needs to be 179 pips in order to break even. This week’s Weekly TCD Long was a staggering 414 pips. The 21 bar average Weekly TCD Long is only 337 pips – clearly “anomalistic” at the core.
Take a look back in this journal and notice what the results were from last week’s Long Swing Trade profile. It captured all of the pips available in last week’s Swing Trade profile on a very nice normative TCD peak.
The current Monthly TCD Short is 299 pips Strategic, 480 pips Tactical and 453 pips Real-Time. If you have run the numbers that I gave you, then you will see this as well. Without those numbers in the three (3) primary TCD dimensions, you won’t be able to see it.
Therefore, since May 1st launches the new Month and since the current close price is right on top of this month’s TCD Long max point, all that is needed is for the next Monthly TCD Short to reach a fill% of about 60% in order to reach break-even on this Swing Trade profile. The average Monthly Tactical TCD Short-F% is above 60%.
So, this trade breaks-even on a Monthly Tactical TCD Short-F% = 60%. This trade runs profitable to some degree on any F% greater than 60%.
I love this trade! It is a great post card from the other side. It will prove that TCDs are king in the FX markets even when news impacts a trade. All of the Day Trades struck their targets this week with the exception of the first which broke even on failure to produce after 24 hours. All of those Day Trades used the exact same TCD structures at the core (of course, there is a lot more going on behind the scenes of this engine). Swing Trades operate in the same way but they take longer to unfold. Remember, that the TCD stretches from one bar into the next bar into the future.
So, when you run into anomalistic phases such as this weekly TCD anomaly AND you have entered the trade next to an adjacent TCD that is larger and getting close to its expiration and reversal, it all becomes a waiting game until the larger TCD comes to bail you out.
What happens if the larger TCD does not bail you out? Then the system plainly failed. That’s why I have integrated ALL TCDs into a single trading system engine and why I don’t rely on just one to trade with. I’m always trading one with its bigger brother in a position to bail me out should something go wrong with the smaller – making total losses very rare.
When this happens and it works out correctly, I typically waste time and not money and I don’t mind every once in a while losing time – just as long as I don’t drop much money on the table. So, in times like these, I hold my postion and go work on some other project, golf, or take a flight while the bigger TCD initiates and executes to maturity. Then I come back to either break-even or take a smaller profit than originally expected. Sometimes, the larger “next” TCD is so strong, that I can even walk away with the originally projected profits. That typically happens on a Day to Swing relationship, but not typically on the Swing to Outlook relationship.
Ok – got to get out of here, I’m already late and I’ve got an IFR flight plan that needs to be filed and no weather briefing yet. See you guys next week!
Last edited:
jezza888 said:I'm just glad I'm not short Euro!
But Jezza havent you realised that a near 300 pip drawdown is all part of the 7th Signal master plan?
jezza888
Well-known member
- Messages
- 441
- Likes
- 24
zuke said:But Jezza havent you realised that a near 300 pip drawdown is all part of the 7th Signal master plan?
Thats handy because after both cable and Euro breaking up through some pretty major resistance, it could be a while before that trade sees a profit!
7thSignalTrader
Well-known member
- Messages
- 351
- Likes
- 7
4/30/06 to 5/31/06
Too much news for too long a period of time spelled the death of last week's Swing Trade profile. As stated previously, the average draw-down currently running in the system for Swing Trades was only 71 pips and if I were to trade such profiles, I most likely would not allow them to run beyond a 100 draw in any event. I can't see a scenario historically when this system has ever needed or required a 100 pip draw on a Swing Trade profile. So, that most likely would have been my max had I actually been in the trade, but that is what this testing is all about.
The second half of last week's Swing Trade profile test is now the recovery process. As I stated last week, I had not focused on or traded Swing profiles in this system as I am not a Swing Trader and as the system was never designed for long range bombing missions. However, all of the previous Swing's in this journal closed with either positive pips for the same 5 day period, or struck through their targets, so I'm happy with that from a purely historical perspective.
Once again, I'll be busy initiating other things this week and for the remainder of this entire month. So, given that this is the first trading day of the Month, this would be the best time to finally get a chance to test out the Outlook Trade Profile. So, that will be the trade in focus from April 30th, 2006 to May 1st, 2006. I will post weekly updates here in this journal tracking this trade ONCE per week and it will mostly likely be on each Friday until the 1st of May - unless something extraordinary happens during the course of each week. I need to run the system through all of its paces, and this being the first trading day of the month, it matches perfectly with the Outlook Trade's Session Start time.
Short term focus: Previous Week's Swing Trade profile recovery.
Though I don't tolerate -100 pip trades of any kind, I still need to know how the system recovers from having a fluky news driven week against its Swing profile. So, I'll be keeping an eye periodically on the price as it returns towards the open price of the previous Swing profile. Since this system has no move in its historical database this large against any Swing profile, this particular recovery will be in uncharted territory. The idea is to simply note how much recovery is possible under such extreme draw down conditions - more of a mental note than anything else as 250+ draws are well outside of my Swing profile's range of tolerance.
Long term focus: Outlook Trade profile results by end of May, 2006.
Seeing how the first live test of an Outlook Trade Profile works out. I have always been a pure Day Trader, but as my account balances (5 live Institutional Accounts) grow over the next 1-3 years, I will be refining the system and rolling my primary trading frame of reference into the Outlook (Position Trader) profile. But, I will need to see at least 1 more year of these types of long range bomber missions before I can have enough data to tighten the target parameters enough such that the system hits its Outlook targets on a fairly high accuracy basis month after month.
Outlook Trade profiles are the longest range projections that this system generates and the shortest time frame for an Outlook Trade profile is 1 month with the long range projections running up to 7 months at times. Eventually, this is where I'd like to be as a trader and that will require executed very large cash positions in each Outlook Trade of no less than $10 million per trade and no more than 10% of the total account balance. So, I've got several more months of Day Trading before I reach that level and then another year or two of data capture for these Outlook Trade profiles before I will have enough data to tweak the system's Outlook targeting package to a level that I can live with and that move my Revenue Model forward for the next 5+ years of long range trading.
For those that have been following the progress of this system and my trading in general, you will recognize this as a major shift in my trading paradigm having always been a 100% pure Day Trader for about six (6) straight. However, I do have other projects and my trading business will need to fund those projects in the years to come - so I won't have the time to dedicate to the daily grind of trading each day. Thus, the Outlook profile will become the bread and butter 30 day trade for me in the future.
I will be testing this trade with a very tiny execution of 1,000 Mini Lots from my test account. This will be a live test whereas last week's Swing was not. These Outlook Trade's are a bit easier to walk away from without harm as typically there will not be the same anomalistic or abnormal price action causes by fluke news that the EURUSD experienced last week that will prevail for the entire month. So, at least break-even should be fair easy to accomplish. I'm more interested in how much of the Outlook Trade's target will actually get consumed over the next 30 days or so. Should prove to be interesting!
Those not on the Internet Troll Banned List (please see post number 272 for details: http://www.trade2win.com/boards/showpost.php?p=249746&postcount=272), I will get back to any questions, comments or concerns that you might have on each EOW update during this Outlook Trade. So, if you have any questions, expect my reply by Friday EOD.
That's my agenda for this month - I'll see you back here on Friday of this week with the first of four (4) system performance and trade observations for this Outlook Trade test.
Attachments
Lighthouse
Junior member
- Messages
- 36
- Likes
- 2
7thSignalTrader said:Sorry, but I'm sitting here laughing out loud looking at this system and some of my "visual aids" (TCD Charts) and can't help but feel sorry for those that will get caught holding the long-term long positions - too long!
This thing is ripe for a total liquidation of assets! 😱 People are being slowly sucked into the "long fever" this week. Some of it very valid and profitable, but these latter stages of the “big sucker punch” are the ones I typically find rather amusing to watch unfold.
Sorry, but I just had to say something before the plunge. Remember this: the long this sucker punch continues, the bigger the panic selling will be in the end. I’ve seen these Papa Bubbles for years now in various different forms (the long bubbles are the worst for late comers) and they never cease to amaze me in the end.
Mark down between now and May 1st, 2006, on your calendars. The day of reckoning draweth near.
WARNING! in the next few hours to the next few days, this Long circus bubble will be over and the circus tent will come crashing down.
To be fore warned is to be fore armed. Trade “short-term” Longs very cautiously unless you have an “Outlook” Trade profile point of view. In that case, you are doing just fine and the next 9 months will be very rewarding – just like the first 3 were this year on the Outlook profile.
See you next week!
I said in one of my earlier posts that this clown will allways come back after losing trades to give some BS as to why he didn't actualy lose. He has totaly run out of options now so he comes back with the ultimate insult to peoples intelligence. "well of course I didn't actually take the trade in the first place" !!!!
I trade for a living and find it both sad and annoying that people like this are allowed to continualy post what is so obviously absolute rubbish on public forums.
7th and your little band of followers of Echelon, Brabed, Dougan et al, I won't be wasting anymore time on this thread you will be glad to hear. I have better things to do with my time.
If it wan't so pathetic it would actualy be quite funny.
Well I think that the readers of this thread must all agree that the years spent developing this system have really paid off.
Let's look at what we have.
1. A attractive spreadsheet with interesting use of fonts and colours.
2. An over used thesaurus combined with a knackered keyboard through typing so much drivel, after all why use 5 words when you can use 50.
3. A system that is hyped by it's creator as something that mere mortals could not possibly comprehend. Yet it turns out that he does not have the confidence to trade it himself. The only exception to that being if the trade result was positive in which case it was banked.
4. The achievement of becoming the biggest laughing stock on this board, kudos to you.
5. A complete lack of respect in record time.
6. No money!
I echo the previous comments. As someone who trades his own money and is profitable I find it insulting that this cretin continues to post in such a condescending tone to all, particularly when he is such a lousy trader who only wins with hindsight.
My suggestion would be to seek a career in showbiz, I hear 'The Muppets' are looking to make a comeback!
'For those that have been following the progress of this system and my trading in general, you will recognize this as a major shift in my trading paradigm having always been a 100% pure Day Trader for about six (6) straight. However, I do have other projects and my trading business will need to fund those projects in the years to come - so I won't have the time to dedicate to the daily grind of trading each day. Thus, the Outlook profile will become the bread and butter 30 day trade for me in the future.'
After the grand success that you have shown I wish you all the best with your other projects. Just remember these wise words 'Do you want fries with that?'
7th, tell us how you did not trade the day signal yesterday -- and that you are still 98% .....
probably something like "I clearly did not trade the day signal yesterday, even though the dashboard reveals that it looks like i have, the beta testing of the outlook trade has taken precedence over everything, and everyone has misunderstood my post. If you look carefully, you will notice that I am a complete lunatic, and that only I must be able to understand looking at the dashboard, because, all of you have somehow miscontrued "inbound" to mean that i am in a live trade...you guys are all idiots"
i am waiting.....
Spam Man
Active member
- Messages
- 146
- Likes
- 104
Whilst I don't have the faintest idea what this bloke is going on about, his thread has given me some brilliant ideas for clever-looking stuff to put on my Excel trading spreadsheet. Next time my girlfriend wanders in, she won't find me staring blankly at the screen while some numbers blink listlessly back at me - oh no my friends. I will be perusing my Tactical Digital Dashboard! It will have a Weather Radar!?! All Location Binding Sequences will be fed through the External Complicator before changing Status to Parity! All my Apex Omegas will be Inbound!
SHE'LL THINK I'M A FOOKING GENIUS!!!
SHE'LL THINK I'M A FOOKING GENIUS!!!
He's gone to Moneytec !jezza888 said:Don't you just hate it when your following a journal and then the poster vanishes...........!
7th, where have you gone? 😱 😆
http://www.moneytec.com/forums/188914-post11.html
and taken all his money with him
"And, it uses NO conventional TA whatsoever. Every single indicator is a new creation – a new construct – a new vision for analyzing market data. Outside the box innovation, made this possible.
I’ve taken that trading application and its many variants (sub-versions) and pushed $800 dollars (initially as a challenge given to me by someone else) to more than $52 million as of this date: April 6th, 2006, with today’s resultant trade of 500 lots by 15 executions resulting in a net gain of $405,000.00 on an initial aggregate cost basis (all 15 executions) trade of $375,000.00 to the Short side from an entry of $1.2282 down to $1.2228 (currently still open) – just as an example"
Charlton
hoangmphung
Newbie
- Messages
- 7
- Likes
- 0
Hi 7ST,
Nice to see you back posting. Since you didn't come back to ET board, I thought I'd lost you.
Just to let you know. In the last few weeks, I've been experimenting with your TCD concept. Nothing concrete yet but I think I could see when the price is about to turn using the continuous TCDs. I'm now focusing on estimating the magnitude of the next TCD. Been reading up statistics books. It is tough but I'm confident I can do it. I don't know if you can drop some pointers to help me to speed up. If not, I'll understand. The important thing is the inspiration and conviction I have from your posts that it can be done. Thanks very much for that.
By the way, your comments on the BindLoc and relation between weekly and daily TCDs helped me a lot. That was really a :idea: moment for me 😀
hoangmphung said:Hi 7ST,
Nice to see you back posting. Since you didn't come back to ET board, I thought I'd lost you.
Just to let you know. In the last few weeks, I've been experimenting with your TCD concept. Nothing concrete yet but I think I could see when the price is about to turn using the continuous TCDs. I'm now focusing on estimating the magnitude of the next TCD. Been reading up statistics books. It is tough but I'm confident I can do it. I don't know if you can drop some pointers to help me to speed up. If not, I'll understand. The important thing is the inspiration and conviction I have from your posts that it can be done. Thanks very much for that.
By the way, your comments on the BindLoc and relation between weekly and daily TCDs helped me a lot. That was really a :idea: moment for me 😀
I dont know whether to laugh or cry at this post 🙄
7thSignalTrader
Well-known member
- Messages
- 351
- Likes
- 7
5/1/06 to 6/1/06 Outlook Notes and Observations
The Signal:
Outlook Trade profile draw currently running at 118 pips with a median Outlook draw of 121.5 pips and a median pip gain of 303 pips, so this profile is currently within specs with an initial move of Long which fits the historical profile. Three (3) more weeks remaining in this profile segment with its minimum time-frame being 1 month and its current maximum time-frame ranging from 1 to 3 months. Once again, the bigger the signal type the bigger the magnitudes the bigger the moves which translates to bigger draws and bigger net P/L. Outlook Trade profiles are not day trades, thus their time-frames cannot be compared to those of day trades. Everything happens slower and to a much larger magnitude.
This same signal turned from Red/Short back in October/November of 2005, to Green/Long near the mid 1700’s. The EURUSD then dipped down to its multi-month low of 1640 and has never looked back climbing through the Outlook Trade profile target which recently rose to the 2700 level last week. So, the Outlook signal turns the corner before the market does by design. It is a super long range signal that has at times extended up to seven (7) months into the future. So, seeing the signal turn Red/Short this month and seeing the EURUSD price blip 118 pips above its entry, is fairly common. Current Outlook Trade profile target is now showing as 2074 and of course is subject to change within the next 3 weeks depending on whether or not the Outlook signal extends its projects through and beyond the same 3-4 week period. Outlook is very slow. It is not a fast mover and cannot be fast moving. If it did, it would not be an “Outlook” signal.
The Market:
EURUSD being propped up by massive rate speculation on both sides of the equation (both European and US based). From a purely technical standpoint, the EURUSD should have crashed one (1) week ago. Yet, this week’s aggregate price movement has been higher. The last two Swing Trade profiles have gotten killed due primarily to news on EU and US interest rates forcing a super-extended “fundamental trend”. The astute Swing Trader already recognizes the distinction between a “fundamental trend” and a “technical trend”. The two are quite different and do not mathematically resemble each other, however the aggregate price behavior is very similar as the price will either move up over an extended period of time, or down. However, that is where the similarities come to and end. I won’t get into the technical distinctions between the two here other than to label them in my Notes and Observations.
The biggest and most obvious FX market mover is Interest Rates. However, there are two (2) schools of thought in the aggregate that determine how people react to rate based news, or what they perceive as rate based news. Camp One says that what moves FX prices should be the higher of two competing rate levels. Camp Two says that what moves FX prices should be the higher of two competing rate levels PLUS the magnitude and directional movement of the delta between both competing rates – aka: the Rate Differential.
Clearly, this has caused much confusion over the past two weeks and is most likely what helped to fuel additional speculative buying of the EUR. US rates clearly have the higher value per dollar over their counter-part in the pair and for 16 months over the last 21 months, the USD has been clearly moving higher while the EUR has been clearly moving lower. Camp One has been winning the rate chaser competition for 16 of the past 1.35 months, clearly.
Camp Two, has just recently sustained a one month victory over Camp One and has also sustained now a one week victory as well. Trichet made it abundantly clear that EU rates would go higher at least for now while Bernanke steps all over his tongue making it difficult for the “experts” to come to an overwhelming consensus on where the Bernanke focus will be and should be. Many in the US though that today’s Non-Farm Employment numbers would be significantly higher than expected which would force Bernanke’s hand and likewise force the Fed into raising US rates – this in turn would have staged the turning point for a nice USD bounce and a EUR decline which would have matched the profile perfectly after a slight Outlook draw-down earlier in the week.
Now, the focus on “news” relative to moving the EURUSD will be on relative internal national economic data between BOTH countries more so than usual for the remainder of the month of May, 2006. This should put the EURUSD back into a more normative/normal price behavioral pattern and that should allow for the natural TCD tendency to take over and move price. The next big US Fed rate news should come out next week and provide for the catalyst that should have been seen a full week ago from a purely technical standpoint.
Fundamentals rule the market by definition. The problem with trading on purely fundamental “causalities” can be clearly seen in the past two weeks of EURUSD price behavior AND today’s outcome on US Non-Farm Employment data. If you were a pure Fundamentalist then you were Short the EURUSD or at least your very short term thoughts were Short given the fact that in the US, the data was ”expected” to be pro-USD. Thus, today’s data was a shock to the fundamental traders that were expecting to be Short on the news.
Fundamental speculation and News are two of the biggest reasons why I don’t make my living in the market as a long-term long-range trader and the past two weeks once again confirms the decision that I made for myself to focus the vast majority of my development time and energy on building a solid day trading system.
The System:
As mentioned above (and many times previously) this system was not designed as a long range bomber, but as a pure Day Trading Technology. This week and last week’s day trades were outstanding. The system auto-adjusted it’s Stops and Limits almost to perfection this week and last week. So, I’m very happy (giddy) with that. All performance calculations on accuracy are based on a 280 Day Trade period, not Swing or Outlook Trade profiles and never have been based on Swing or Outlook profiles.
The Swing and Outlook components of the system at this stage is for Day Trade Signal support and confirmation. As stated previously many times before, I don’t typically trade the longer time-frames as I am a pure Day Trader and always have been. However, the system does use longer time-frame data for decision support of the Day Trade and in that role, I am very happy with how it support, confirms or contradicts the Day Trades. I will also sometimes use the Swing Trade as a fail-over for a Day Trade profile that does not perform as expected, but only under the protocols already given. (this is pretty much a restatement of what I’ve already said several times before)
At some point in the future, I will have enough historical metadata on the Swing and Outlook Trade profiles stored in the systems metadata database to be able to go to work on the last module that I intend to build for this system which will be the News Counter Module. That system module will be the most complex of all the modules as it will take expected market news and convert it into a weighted input into both the Swing and Outlook Trade profile generators. Essentially, this module will counter and therefore reverse a Swing or Outlook signal (mostly Swing signal as very few Outlook signals will get countered/reversed) to match the “market expectation” stemming from clear expected news that historically has a good track record of moving markets. I suspect that there will be very few of these Swing counter signals that get executed over the course of a 52 trading week year. However, if I can code the system to correctly counter enough Swing Trade profiles using the new news module, then that will go a long way to improving the aggregate annual Swing Trade accuracy. I expect very few Outlook Trade profiles to get countered as there will only be 12 of those types of signals each year.
Current Trade Related Projects:
As usual, I always have an advanced version of the system running in the background and when I get time to work on it, I add things that I think will be good future improvements to the current production version seen here. No on has seen the advanced version as I do not talk about or show pics of the advanced version very much (most don’t even know that it exists).
My goal has always been the “perfect” Day Trading System. For me that means 99% trading accuracy on a daily basis to a specified target or to at least break-even and constant geometric growth of capital. Right now, the Day Trading profiles are running at just under 91.38% which is down from 93.12% two weeks ago. This super-trend has caused two additional failures over the past 21 trades which has lowered the overall Day Trading accuracy to 91.38% - the lowest day-to-day accuracy in 8.7 months. However, I think I can do better!
I’ve been testing the advanced version of the system using a completely new trade profile type. It is a Non-Directional trade profile consisting of 12 trades maximum and between 6 to 7 trades minimum all entered currently but executed one at a time. I cannot go into any of the details, but I have seen a perfect 100% accuracy to the Revenue Model target or at least Break-Even. It seems to generates between 0 pips and 90 pips on every execution on the block of trades. One of the most surprising and hottest features of this new Trade Profile is that each trade profile containing the 6 to 12 individual trades can reused at any time and at any point during the 24 hour trading session. So, once one set of targets has been struck within the profile, I can simply re-enter the entire profile at whatever the current close price is at any point along the 24 hour trading session.
In essence, I think I may have stumbled upon the Always-In trading solution that I’ve been shooting for during the past six (6) years! It removes the need to know Direction and it removes the need to have any Timing requirement whatsoever and no Probability is necessary. The only thing is requires is Magnitude – simple – Movement. A total fire-and-forget system with re-usable profiles that never need altering, just a change in Stops and Limits on the trading platform.
I’m going to start doing some live tests next week as I continue to work on modifying the layout of the Trade Profile Section of the Dashboard to accommodate the new trade set-ups. I will not be showing these trade profiles here as I don’t want this to be seen by the general public as this time. Maybe in the future that will change – but I seriously doubt it.
Everyone’s “holy grail” is different depending on what the trader is attempting to accomplish. Mine has very specific daily requirements and for the first time in my trading career, I “think” that I can say without much concern that I’ve finally found mine. Only time will tell but from everything that I can see, the market really does have to do some extremely bizarre and hopelessly ridiculous things in order for it to ever fail.
I look forward to next week’s trading like I’ve never looked forward to any new trading week in my life! I LOVE this business. 🙂
I’ll be back for next Friday’s Outlook Trade profile report.
7thSignalTrader
Well-known member
- Messages
- 351
- Likes
- 7
hoangmphung said:Hi 7ST,
Nice to see you back posting. Since you didn't come back to ET board, I thought I'd lost you.
Just to let you know. In the last few weeks, I've been experimenting with your TCD concept. Nothing concrete yet but I think I could see when the price is about to turn using the continuous TCDs. I'm now focusing on estimating the magnitude of the next TCD. Been reading up statistics books. It is tough but I'm confident I can do it. I don't know if you can drop some pointers to help me to speed up. If not, I'll understand. The important thing is the inspiration and conviction I have from your posts that it can be done. Thanks very much for that.
By the way, your comments on the BindLoc and relation between weekly and daily TCDs helped me a lot. That was really a :idea: moment for me 😀
Hongmphung,
Good to see you again. 🙂
The ET board has been blown to bits. It was off-line for so long that I gave up on every coming back. Not sure if they got hacked, changed servers and forgot to tell people (how crazy that would be) or simply ran into some serious technical difficulties - but they have been down for a while and I've since moved.
Yes, on the Day Trade basis, the LocBindVar as been working out very nicely in BOTH directions! Counter moves on the Day Trade basis against the "trend" waiting on significant Daily TCD Long Fills, worked out nicely this week as the EURUSD moved back into a more normalized Daily TCD configuration. The Daily TCDs stabilized this week while the Weekly and Monthly TCDs are still ballistic to the Long side of the equation. They are so extremely over-bought that the plunge down is going to such the air out of the lungs of all the “trend traders” when it happens. The Monthly TCD Short is only 38+% right now with the Monthly TCD Long at 115% and its Omega at only 44.26%. If the Monthly Omega expands to anywhere near 100% (its normal Omega Target) the Monthly TCD Long would go off the chart! Thus, the Monthly TCD Short at 38% will need to back-fill at some point. The same question applies: How much back-fill will be in order.
The thing you can do to “speed things up” a bit, is make sure you have ALL THREE (3) TCD types at your disposal and pay close attention to any adverse news on your Day Trades. In the beginning, I would start out by only trading those segments where the Subordinate Daily TCD has filled between 90% to 100%+ and then watch it snap back into the Dominant Daily TCD. That is a good, clean and quick way to get started trading TCDs on a Daily basis. You won’t get as many signals as I do with this, but the ones that you will get will be very high probability 24 hour trades.
So, run the TCD numbers, note the Dominant and Subordinate TCD (Dominate will be the largest of the two) and then wait patiently for a Subordinate Daily TCD to fill to between 90% to 100%+ and then enter a 24 hour Day Trade into the direction of the Dominant TCD. This will ensure that you are trading with the “trend” – like so many people like to do and it will give you high probability trades with a strong probability for a 24-48 hour break-even several times. In other words, it will give you more cushion to work with as you learn more about how TCDs work.
Most people can’t even see them! So, the fact that you are learning about them and actually using them to some extend says a lot about your ability to see and work with the abstract – good work!
LockBind will be a good guide for helping you recognize and project the next trajectory/TCD. You won’t get as many trade signals by doing this, but the one’s you do get will be safer trades. What my current system does now is more probabilistic than anything else and there is a lot more going on behind the scenes than just the TCDs – but the TCDs are at the core of the system.
However, my advanced project will remove the need to know Direction, Timing and Probability and will only require Magnitude! My pip capture will go down a bit per Daily profile, but the accuracy will go through the roof and that will advance the Revenue Model a lot faster – almost twice as fast. It will incorporate about 6 to 12 total trades per session and allow me to trade extreme TCD extensions like polar ice caps bracketing things in-ward for a few more pips each session.
It will use the Day Trade Signal as the pointer for the very first trade in the sequence of trades. Every other trade in the sequence will radiate outward from the Day Trade profile signal and the extreme TCD extensions will pull things back in-ward once Omega has expanded to maximum levels. I’m also going to build it such that the only way the system will execute a trade against the dominant TCD, will be when the dominant TCD has made something close to a new TCD-F% high. That will tip the probability for that extreme TCD trade far into the brain-dead column. 😉
For now – just to ease your way into TCDs – make sure you trade the dominant Daily TCD but only after you get a good fill-% on the subordinate Daily TCD. Build the rest of your TCD based system around that concept and you will have a good platform for doing future work on Anti-Trend TCD based trades. 😉
Similar threads
- Replies
- 1
- Views
- 4K
- Replies
- 0
- Views
- 2K