A Professional Approach to Trading Futures

Mentioned this in a previous post

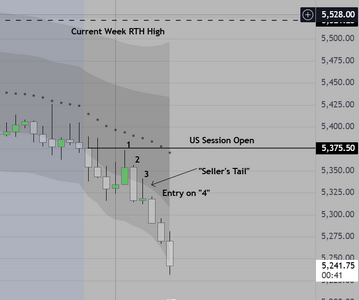
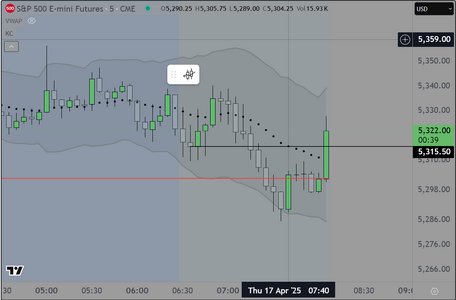
This is a special example of a "1-2-3" setup
where one of the candles has a long tail, which
we call either a "buyer's or seller's tail". This
type of candle suggests that price was moved in
one direction initially, then failed as the other side
came in (more aggressively) to reverse. In the right
context it confirms that the reversal will continue
 

Attachments

  • 15 minute exmaple.PNG
    15 minute exmaple.PNG
    41.9 KB · Views: 41
This will be my last post today

Readers please make note of the timing of
this post. Here on the west coast USA it is
12:26, and in London 8:26

In thirty minutes, if one were to monitor
volume on the S&P Futures, you WILL see
a significant spike in volume followed by
continuation. This is known in my world
as "last call". Does not always play out
(nothing does) however this one trade
can sometimes make your day.

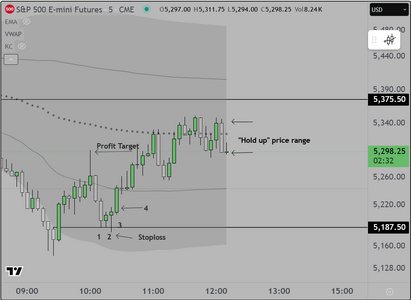
The attached chart shows an example of
what professionals call "Holdups or hold up prices"
In this range, institutions fight it out to see which
side will control and create a final "leg" up or down
and of course, sometimes neither side wins and
the market simply moves sideways into the close

Good Luck
 

Attachments

  • Late Reversal & Holdup Example.PNG
    Late Reversal & Holdup Example.PNG
    58.8 KB · Views: 14
Before I walk out the door I have time
for this last post

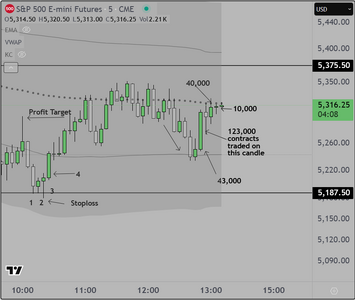
Here is the chart showing the volume
spike at 8:55 London time

Notice the big difference between the
preceding and following candles. We call
this a "tell" and in my class I use it to show
students how to position themselves, once
they have done their post market analysis
Unfortunately I don't have the time or resources
to go into more detail in this forum

Good luck
 

Attachments

  • 0855 Candle.PNG
    0855 Candle.PNG
    59.9 KB · Views: 12
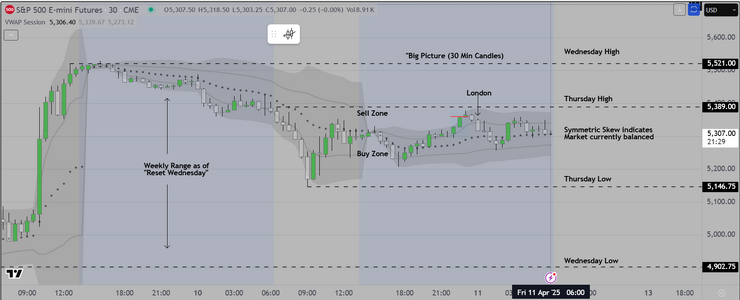
Here is our starting "Big Picture" 30 min candle chart Markup
showing the range as of Wednesday.

Professionals will "Reset" the market on Wednesday, creating a new
range from which to trade. Within that range we look for signs that
institutions are likely to buy the low end, or sell the highs. Of course
there are times (now for example when we are in the middle and we
wait for economic news to provide the impetus for movement in either
direction. Today the US market will start "in balance". When this happens
we look for breakout trades at specific times (3pm London for example)

London provided a nice short opportunity as seen on this chart. We do not
have time to provide entry details, since our market opens quite soon. We may
do that later if time permits

Good luck
 

Attachments

  • Wednesday Reset Example.PNG
    Wednesday Reset Example.PNG
    129.5 KB · Views: 9
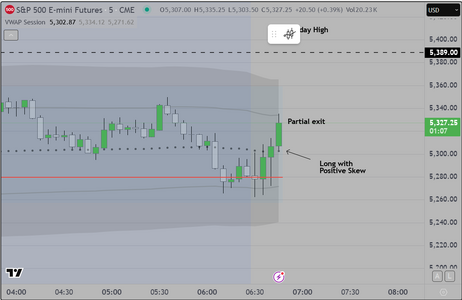
First scalp trade off the open today

We post this one, but will stop at this point
to concentrate on the work at hand

Good luck
 

Attachments

  • Initial Scalp 4011.PNG
    Initial Scalp 4011.PNG
    61 KB · Views: 8
Done for the day

Today was a easy day. Once we identified
the price behavior as "trading range" we made
the required changes as follows

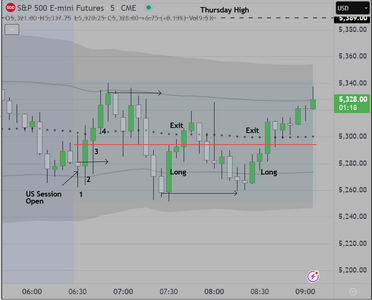
1) We change from 15 mn candles to 5 min candles
2) Entries are restricted to the Buy & Sell Zones which
are represented by the 1st Standard Deviation Lines of
our VWAP envelope
3) The first trade is (for us) usually a scalp and so we used
our preferred 1-2-3 Algo with entry at the start of "4"
4) From that point forward we entered at the edges of the
1st SD, trading from the long side only, because the skew
changed from symmetrical (neutral) to positive (long only).
This indicated to us that the institutions were looking to move
the markets higher, trapping participants as they accumulated
inventory for the late day move (which obviously has not happened
yet).

So the way we train students to act in this context is simple. We provide
a "timing window". For the US session that window extends from 1pm
to approximately 4:30pm London time. Within that time frame we show
them how to obtain a reasonable profit by a) identifying the price behavior
b) using the tools to identify valid setups, c) structuring the trade entries
by using the appropriate order types, and d) executing and holding winners
to a logical exit, while exiting losers at or before the stop is hit. Its that simple.

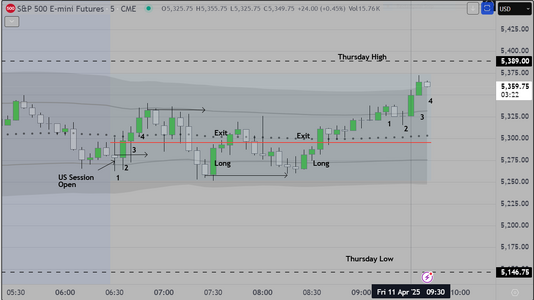
The chart shows the trades. Interestingly we had several students from our original
class watching and some did trade. Two of them had been having difficulty holding
winners. This was their description of the problem. I told them that it was likely that
the REAL problem was they did not accurately identify the context, meaning that they
were entering at times when most professionals were exiting. In plain English, they
were entering late, holding for a short while and then when others were taking profit
they were stuck, or were flushed out at break even (if they were lucky).

Trading range price action is difficult for retail traders. The preferred entry is at the 1st SD band
on a limit order. In volatile markets, this insures that trader gets a reasonable fill
If in contrast, they enter using market orders, they will always pay a sizable spread
meaning that the position had to move further in their desired direction in order for them
to make a profit. Explained this quite a few times, but to no avail. Oh well.

The other option is to stand aside and wait patiently until the market breaks out. There is nothing
wrong with that approach, in fact it often saves retail traders from losing money. Once the market
breaks out and pulls back, they can look for a 1-2-3 and off they go. Usually this is a late day breakout
trade that can be held, sometimes into the last hour.

Good luck
 

Attachments

  • Firday 4-11 trades.PNG
    Firday 4-11 trades.PNG
    60.9 KB · Views: 9
Thank you Sir, for your kind comment

As we were leaving the house, saw what looks to be
a late morning breakout (we spoke about previously) to the upside

entry would be at or near 54 and the profit target 30 pts or more
higher.

Good luck
 

Attachments

  • Late Morning BO 4-11.PNG
    Late Morning BO 4-11.PNG
    72.9 KB · Views: 9
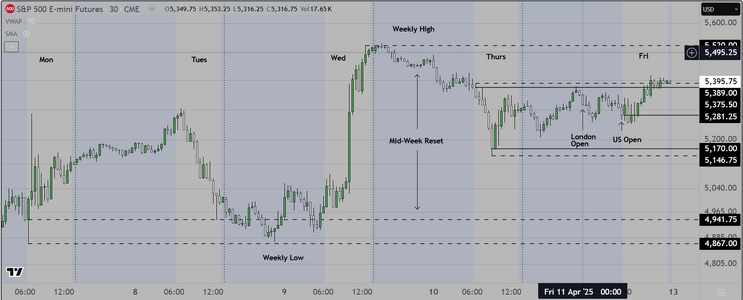
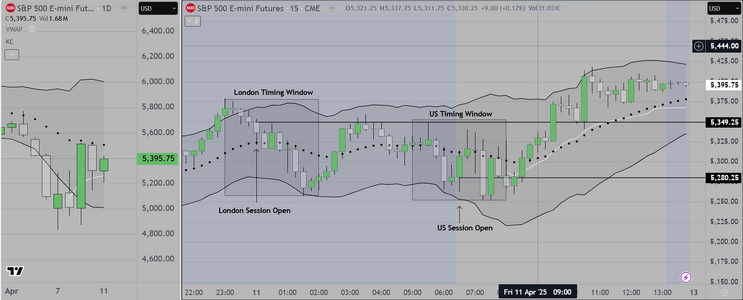
Posting a 30 min markup chart, showing the weekly cycle that forms
the basis of the system that we teach. Retail traders can see that price
tends to move between the weekly highs and lows.

Moving one step further, we transition to a 15 min chart and we divide that
chart into individual "timing windows" (one each for Asia, London and US sessions)
Within each window we show traders how to to look for specific high odds setups.
If the setups present themselves, traders can trade any of the three sessions. IF not
they simply "pass" and move on to the next session, or another market, or they
may elect to wait for the next day's opportunities. This allows traders to be selective
and take only the best setups, reducing losses and maximizing gains.
 

Attachments

  • Weekly Chart.PNG
    Weekly Chart.PNG
    110 KB · Views: 10
Last edited:
Finally, we post a last chart for the weekend

We have been working on a simple system
that incorporates Keltner Channels. It will continue
to use the "Timing Windows". We are still testing
this system and once it passes our basic screening
we will offer it to those may prefer it over the VWAP.
 

Attachments

  • Keltner Channel System.PNG
    Keltner Channel System.PNG
    135.1 KB · Views: 14
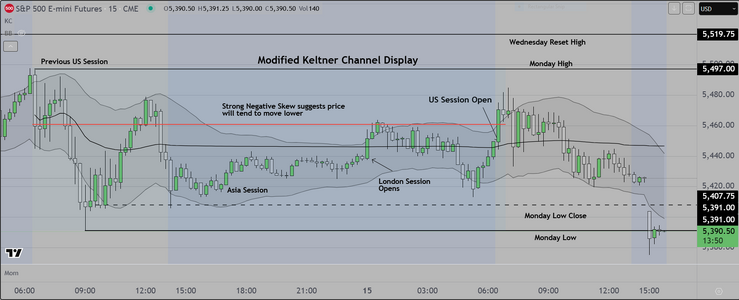
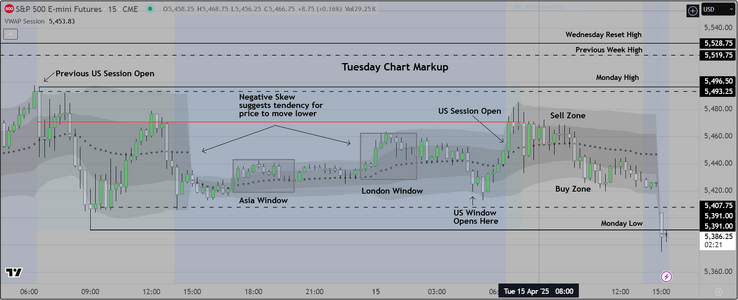
The US session of S&P Futures has completed and we have "marked up"
our chart for the day. We will post this one (the display that we use regularly)
and another that we have developed for retail traders. That one uses Keltner
channels and seems to be more accessible for amateurs who might be struggling
to learn how to trade.

As you look at the right side (we call it a "Modified Keltner Display), there is a lot to
"take in", however some of the more important things to note are as follows

1) This system uses "ATR" (average true range) as its basis, and that corresponds well
with what many commercial firms use as a measure of volatility in the market.

2) Traders may notice that every time price leaves the channel, it tends to reverse back
inside. This is by design.

3) I have modified this display to accommodate my "Statistical Skew" and this means that I can
tell early on, whether price will exhibit a tendency to move higher or lower at each session's open

Finally, readers may notice that this was an inside day, and the skew was negative going into the session
This means that it was quite predictable, to trade the short side and look for scalp trades, rather then swings

The trading plan for this day, was to go into the session looking for ways to get short and then get out with
small profits, several times.
 

Attachments

  • Tuesday Chart Markup.PNG
    Tuesday Chart Markup.PNG
    139 KB · Views: 10
  • Modified Keltner Display.PNG
    Modified Keltner Display.PNG
    131.1 KB · Views: 13
Last edited:
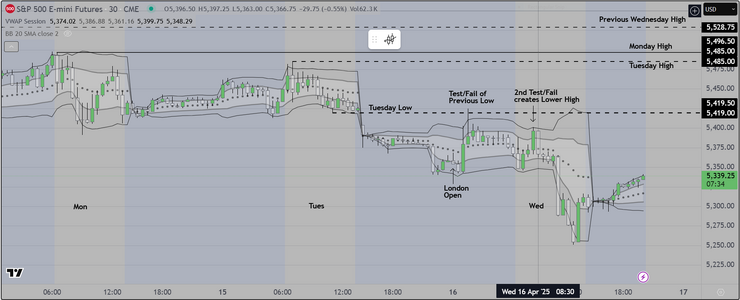
Reading some of the comments from retail amateurs I can't help but be amused
Look readers, success in this endeavor is all about learning how to think critically
how to accurately anticipate the effect of events on the markets. Today was "Typical"
Here is the scenario that a professional (myself) develops based on both common sense
and experience.

1) We know what in response to tariffs, the markets have dropped significantly
2) We know the primary cause of the problem (poor economic policy by a US president)
3) We know that the US President can (and will) change his mind at any point in time AND
that the effect this has on the market is almost as bad as the decision to apply tariffs

So when we look at each session, what do we see? Look at the markup we attached below

1) Price tested (to the upside) and failed twice
2) The 2nd test occurred at the end of the Euro/US overlap, as Euro traders are closing their
book of business.
3) This coincided with Fed Chairman Powell's warning about the effect of tariffs on not only the US
economy, but the world economy.

As a practical matter the important thing to remember is, whenever you (as a trader) see an "impulse" move
in one direction (as we did several times today to the upside), you have to ask "Trade or Trap", and most of the time
if you simply look at the clock and count "Legs", you CAN accurately discern which it is and take the appropriate action
which is to jump on the reversal. This CAN be taught. Retail traders can learn to "read" this combination of price action
and economic news.

I am posting MY preferred chart this evening (VWAP envelope) and it clearly shows price testing high up in the "Sell Zone"
several times. I teach traders 1) the underlying logic, 2) Recognition, and a common sense way of taking action 3) Identify
the first "Test/Fail", then take the next one (which is called "Leg 2") and is usually a bigger (extended move) trade.

Good luck
 

Attachments

  • Down Session Fed Powell Comment.PNG
    Down Session Fed Powell Comment.PNG
    160 KB · Views: 12
Last edited:
Thanks Paul once again for your "Thumbs up"

We are quite busy today, but wanted to post a chart showing the initial move
down and the reversal which happened as anticipated at about 8am PST or about
4pm. We show students how to 1) do the research, identify previous similar instances
and then on a given day, anticipate and trade these programmed opportunities
Once they learn the process it is really quite simple. Today's reversal was good for +10
(for us). Now we will pull back and wait patiently for the end of day event that should
happen in the last hour

Good luck
 

Attachments

  • Timming & Leg Creation.PNG
    Timming & Leg Creation.PNG
    66.1 KB · Views: 12
Hello UK readers

This week I completed testing of two (2) simplified systems meant
to assist retail traders who find themselves struggling. One is a scalping
system, based on 2 minute candles, the other a swing trading system,
based on 15 minutes candles. Both have a significant edge if operated
in a disciplined manner. This week and for the next month I will trade
the small S&P futures (MES) and this will serve as a "live" forward test

My mentor suggested that a good system should be able to be documented
on a single handwritten page, and that is what I have done. I think he would
be pleased.

Time permitting, I will post the results of each day's trading with context as follows

1) I use a framing system based on a weekly cycle. The first two days (Mon-Tues)
serve as the basis, the system looks at the high-low range and assumes that
institutions are accumulating inventory at "wholesale" values, and dispersing it
at "retail" values and vice versa.

2) The process of accumulating & dispersing inventory is known as "trapping"
that is to say, the large institutions move the market in such a way as to motivate
"other" (other meaning "higher" time frame) participants to be "trapped into"
losing positions, and "trapped out of" winning positions. In both cases, they benefit
as the trapped participants have to decide when/where to adjust by scaling in/out.

3) The decision making process starts during the weekend, with analysis of "What Worked"
and review of Pending Economic News. This allows us to forecast the next week's price
action in terms of probable outcomes. We assign percentages to each outcome and direction.
Prior to the open of each NY session, we review the actual effect of Economic News and make
adjustments as necessary. We make final adjustments to our screen display and we
begin our trading day.

Objectives

Daily

For the scalping system, our objectives are to make a series of small trades using volatility based
tools. We look for two (2) scalps beginning at 2pm London time, and one (1) more trade beginning
at 6pm London. We would shut down for the day, if two consecutive trades were losses.

For the Swing system, our objectives are to make two (2) trades, good for a minimum of +10 points
each, at any time after the first 30 minutes. Because the statistical edge for this system is significant,
we would NOT shut down if the first trade were a loser. Instead we would consider scaling in higher or
lower, or alternatively, we would take a loss and move on the next setup.

Setups

The basic setups are entry relative to a key reference. That is to say, we look for a close above or below
a key reference as a point of entry. This can occur in the context of a 1-2-3 algo where candle "4" opens
above or below the key reference.. We also look for 2nd entries, known as H2/L2. We have spoken about
these previously. Finally, we also count "legs" and we look for entries at "leg 2"

Good luck
 
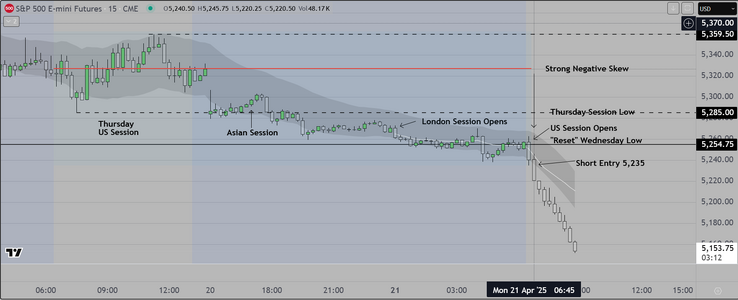
Good Morning from West Coast US

Today's session can be characterized as "Typical" for a Monday
We started by evaluating the Weekly and Daily charts.
We move on to the Economic Calendar (we prefer Invest.com)
and with no pending economic news today, we refer back to the
trading display, where we outline the weekly range.

Traders should note that Wednesday is a "reset" day. That means that
we operate as if the range from Wednesday to Friday is "in play". It is
our primary reference. From that range we look to see how Asia and London
open and trade. As seen in the attached chart, the overnight markets were
relatively quiet, and stayed near the Wednesday low. This "tells" us that the
market continues in a down trend

We markup the chart by adding the FRVP (fixed range volume profile) and we
evaluate the POC relative to the VWAP. That relationship indicates that the high volume
areas are below and the statistical tendency is for price to trade back into that area

At the open, we watch for possible reversal. When no reversal occurs, but instead we
see strong trend bars we enter and hold. In our class, we train traders to see the larger
picture as regards risk. In this context, that means that will accept risk early in the session
and we will trade as big as possible (early), taking a small profit at +10. Professionals call
this "Buying a Stop", and it means that by booking a profit at +10, we can then hold for
an extended period of time, to see if the market will run or reverse. We cannot go into the
math on this and it doesn't matter much because none of you (apparently) have the background
to evaluate it, but we can say that it is easy to prove (mathematically) that the MINIMUM move
for this market is going to be about 3 ATR. This is critically important, because what separates
the professionals from the amateurs is the confidence to accept and manage risk (to hold a position).

We are done until the last hour

Good luck
 

Attachments

  • Mon 21 April.PNG
    Mon 21 April.PNG
    96.6 KB · Views: 7
An interesting post which I have a couple of questions about:

We markup the chart by adding the FRVP (fixed range volume profile)...
How do you determine where this starts and ends or is it based on the Wednesday to Friday range ?

....we can say that it is easy to prove (mathematically) that the MINIMUM move for this market is going to be about 3 ATR
As ATR is already based on volatility of market movement, then a 3 ATR move would be a much bigger move than has been measured up to and at the point of entry. Is this move based on your knowledge of probability and statistics or something else ?
 
As mentioned I have obligations that keep me from posting
in real time. Very soon I will arrange for interested persons to watch
on a "Zoom" meeting screen to see how its done. The bottom line is
that the logic has to be put in place first. Then, when the market opens
the real work happens, as we evaluate what we see in front of us, and
make decisions. In the previous post, I talk about the importance of
preparation. It is also important to use that information in a skilled
fashion to make good decisions

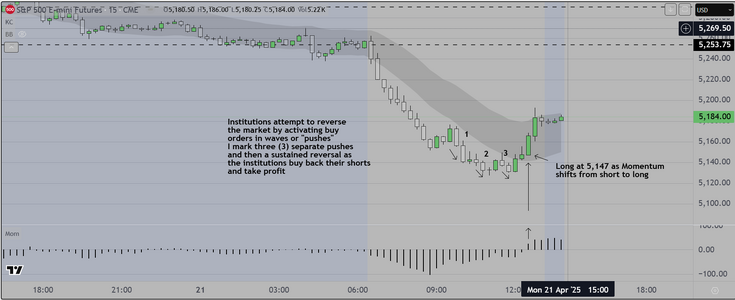
Summary for Today

Prior to and at the open

1) Prior to the open, we knew that the market was (statistically) leaning to the short
side (because of the significant negative skew presented by the red line above the VWAP)
2) We saw that the previous sessions (Asia, London) did not move much, and that signaled
us that on the open, we might see a trend move.
3) The first candles were strong (closing near the lows) and that suggested that institutions
intended to sell. For retail traders, the only way to proceed is to "go with" and the best way to
manage risk is to sell at least two (2) contracts, taking one (1) off at +10. This is called "Buying a Stop"
from that point forward it is up to the judgement of the trader, but we assume that the market is going
to move in multiples of a "standard candle" also known as an "ATR". In this case we want to hold for at
least three (3) more candles, before we consider selling to take profits.

Attempted Reversals

1) At each reversal, traders took profit and attempted to move the markets higher, however they could
not sustain a move until the last hour. This is typical. The final (successful) reversal consisted of three (3)
separate pushes down (also known as a "Wedge"). Once professionals see this constellation, they look for
price to move higher, and we then look for a reversal setup (that we have talked about many times) called
a 1-2-3, where we enter on "4". We assume that this is the price level where institutions will a) take profit
and b) position themselves for the next session. Readers should refer to their charts, and they will see the
last WRB (wide range bar/candle) shows more than 136,000 contracts traded.)

2) Finally, at the bottom of my markup chart, I show a Momentum indicator. and you can see the point at
which it reverses (my arrow). This is as simple as I can make it.

As mentioned, at some point in the near future I will arrange for interested persons to watch while I do this
in real time. I have not decided whether to start another class

Good luck
 

Attachments

  • Late Day Reversal 2.PNG
    Late Day Reversal 2.PNG
    95.7 KB · Views: 9
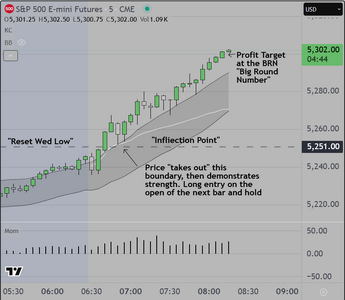
Another easy day trading the US session

We wait for price to take out the initial balance
then for price to test a recent key reference, in
this case it is the low of "Reset Wednesday", then
as price demonstrates strength, we enter long and
hold to the BRN (big round number).

Referring to the chart, this is about as simple as it can
be made. Success depends on 1) preparation, 2) recognition
of the context (where we are in the cycle/trading off of the
nearest key reference) and 3) disciplined execution

I have a person here watching and trading sim. Even though I
told her when I was entering and why, she could not stay in the
trade. The result was that I took +30 while she scalped out at
+6. Admittedly still a profit and a good trade, but readers can
see what a difference it makes to identify the ultimate
destination and know how to get there

In this case I traded six (two units of three each entry) and I as mentioned
previously, I "bought a stop" at +10. Holding the balance to just prior to
the test of the BRN (out at 5,298)

Will stand aside from this point, until the last hour

Good luck
 

Attachments

  • 4-22.PNG
    4-22.PNG
    68.3 KB · Views: 6
Back
Top