A Professional Approach to Trading Futures

We are done for the day

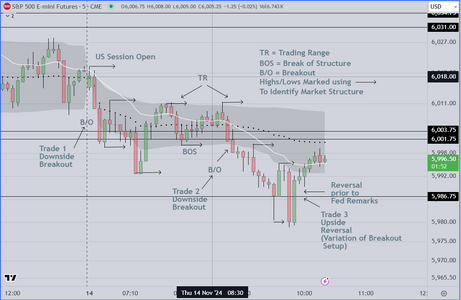
As seen on the chart attached below, the market opened down
providing a nice initial move for +10 pts. Skilled traders will always
act aggressively at these times of day, because they know that the
algos are moving the market and have to obtain at least 10 pts.

After that, we assume that institutions will want to move price down
to a discount level. Why? because they anticipate that Fed Chairman
Powell will have either positive or at the least neutral remarks that
will allow them to buy back their inventory and realize added profit
on the reversal (up)

We had three (3) trades, two (2) shorts and one (1) reversal scalp up
and are done for the day, out as mentioned previously prior to the
Fed comments.

Good Luck
 

Attachments

  • Thursday Markup Nov 14.PNG
    Thursday Markup Nov 14.PNG
    86.4 KB · Views: 20
And here is our Pre-Open Summary for tomorrow
Nov 15 2024

5:30am PST Retail Sales, Consensus 0.3%
Previous Report 0.4% which was
Stronger than expected
6:00am PST Atlanta Fed GDP Consensus 2.5%

--------------------------------------------------------

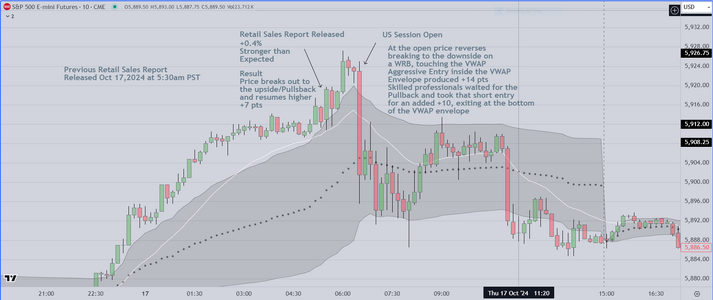
The chart we post is from the previous Retail Sales date
which was October 17th, 2024

As can be seen the release (during the "Magic Hour" at 5:30am PST)
resulted in a breakout to the upside at 6am PST, however when the
Futures opened at 6:30am PST, price reversed to the downside on a
WRB (wide range bar). Professionals call this a "surprise bar" however
it is only a surprise to retail traders. Institutions and Commercials knew
this was coming. Skilled professionals see this WRB and know that even
if they miss it, they can simply wait for the pullback, and enter on the
continuation down to test the bottom of the VWAP envelope.

Scenarios

1) We assume that tomorrow's report will be similar to last month's, however
the resulting price action may or may not include a WRB down. IF it does
repeat that pattern (unlikely) we will "go with" and enter short at the top
of the VWAP envelope.

2) If the report is surprising, we will use the "Bookends" technique to create
a trading range, and trade breakouts in either direction.

3) The GDP is already known (the major institutions have their own economists
and have already got the data figured in) so this data will not impact the market
significantly (The phrase most often used is that it is "baked in")

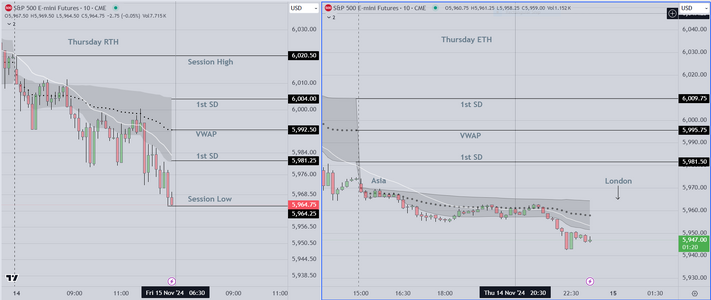
The chart on the right shows both the ETH and RTH versions, and is marked up
to show the basic information. When we get up in the morning, we add markup lines
depending on what the overnight (London) Market does. At this point we are probably
looking at a gap down market. We would expect the gap to be filled within the first two (2)
hours.

Because it is a Friday, it is also possible to see a late day reversal
 

Attachments

  • Retail Sales Oct 17.PNG
    Retail Sales Oct 17.PNG
    136.8 KB · Views: 8
  • Pre-Open Chart.PNG
    Pre-Open Chart.PNG
    98.4 KB · Views: 8
Last edited:
Well

Can't take the trades for others, but I will point out
that this seems to have worked out similarly to the previous
chart & post

Reposting today's US Session original chart to show the setup and entry point
If a reader reviews the previous "pre-open summary" it is clear that there is a
tendency for the market to repeat patterns and identifying repetition is the way
that skilled professionals make money

A nice profitable day

Good luck
 

Attachments

  • Repost Orignal Chart.PNG
    Repost Orignal Chart.PNG
    68.3 KB · Views: 7
Last edited:
Comments to end the week

As I mentioned in previous posts, I closed out my recent class after
reviewing each student's performance. This is a process that I always
go through, in order to deliver what (in my opinion) really matters
and that is an honest evaluation covering each students ability

1) To collect and accurately analyze data
2) To create a reasonable trading plan
3) To display the discipline necessary to execute that plan
and (importantly) to learn from the results and make adjustments.

Students inquiring about our class were sent a questionnaire,
and an agenda, asking if they would commit to the following;

A) Showing up (consistently) at specific times for the "pre-opening meeting"
B) Participating in the "Review of Data" prior to trading
C) Learning to accurately identify (specific) price action patterns
D) Learning when to enter, and how to manage risk.
E) Participating in a weekly meeting titled "Lessons Learned" during
which we (all) look at what worked, and what did not work in detail.

Ultimately most applicants would not agree to one or more of these requirements.
When "push came to shove" they were not willing to devote time (about an hour
every Saturday or Sunday) to learn the "essential skills" of trading proficiency.
Apparently what they really wanted, was to pay me to be a "signaling service".
(I declined).

At this point I may stop, although this has been a good experience
and good practice because it has helped me to stay disciplined.

As regards another class, I have not decided.

Good Luck
 
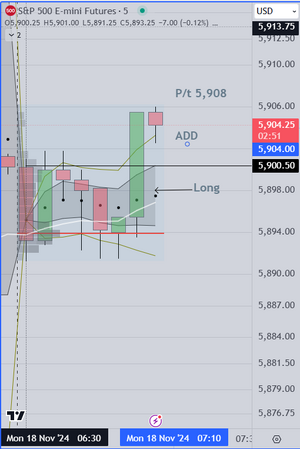
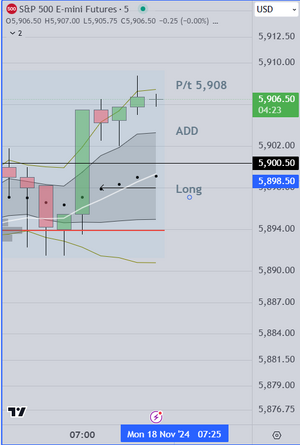
and my exit at +10

Check your own charts and the time stamp

Hard to do this AND trade, but as can be seen
This was a reasonable entry, added as seen at the
VWAP 1st SD, per my own understanding of Stats
and exited as expected, as institutions moved
the market to their early targets overhead

The skew agreed and was one of two (2) factors
that guide my decisions

If anyone has an interest in finding out more about
how I do this, THIS would be the time to express yourself
before I stop posting

PostScript

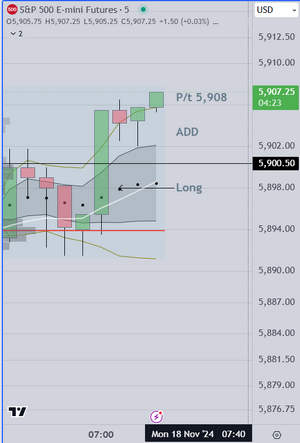
Just added another chart providing a better look at this trade
Obviously the Profit Target was reached. That's +10
and now I monitor and wait for the next opportunity.
Since this is a Monday, I am very careful not to give it back
by being too aggressive.

Good Luck
 

Attachments

  • Exit.PNG
    Exit.PNG
    38.6 KB · Views: 4
  • Exit.PNG
    Exit.PNG
    38.2 KB · Views: 7
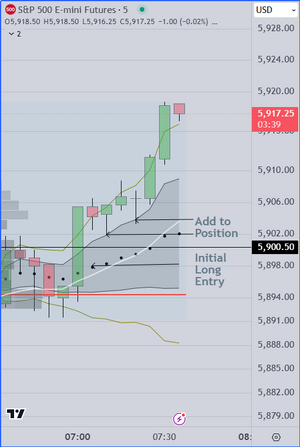
I suspect this will be my last post today

The main points I want to make are as follows

1) Markets move in "Legs". This is because the institutions
want to pause and determine whether other participants
are aligned with the current trend (if one exists). Generally
the odds favor trading the 1st & 2nd Legs. Position size is
one of the things I teach. In this instance I am trading units
of 3.

2) My preferred entry is based on a simple Breakout setup
my 2nd entry is based on a test of the SD (Standard Deviation Band)
As long as the Skew is positive, I will add AT a test of the SD (as I did
today). This is difficult for retail traders who traditionally lack the
understanding of Statistics. As can plainly be seen it worked out
well today.

3) Although this trade continued to +20, I exited most of my initial
position at + 10, WHY? Because it is a Monday and my research of
suggests that Mondays tend to be "trading range" days where
participants are taking profits at +10. So I did leave some money
on the table today.

Good luck
 

Attachments

  • update.PNG
    update.PNG
    44.9 KB · Views: 7
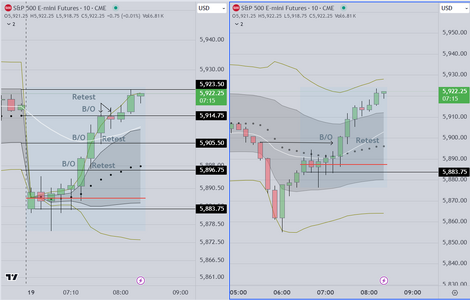
Today's charts

These charts are the basis of the system that I teach
There are two types of charts and markups
The chart on the left is RTH (Regular Trade Hours)
and on the right ETH (Shows the Overnight Trade)
including Asia & London Markets.

Personally it does not make a difference for my own
trading however retail traders have difficulty "reading"
one or the other, so we provide alternatives

As regards time frame, we suggest that retail traders
adopt the 10 minute time frame because it tends to
show trending behavior and "true" patterns more
accurately.

Today was an easy day. The US market opened (as it often
does) showing "TR" trading range behavior, characterized by
overlapping bars and prominent tails. As we have mentioned
previously, we suggest retail traders wait patiently for the
market to breakout above or below. Today it broke to the upside
and we marked the numerous breakout and pullback opportunities

There are many ways to make money in this type of environment
We recommend early entry on the first pullback, holding for a minimum
of 5 pts, then cashing out and letting at least one (1) contract run to
either End of Day (EOD) or to a profit target of +20. Today both targets
were obtained.

Important Postscript

We forgot to mention that the chart on the right shows a horizontal line
extending from a candle. That candle is called an "event" candle, meaning
that at least one (1) or more economic releases occurred at that time. In
this case the "events" were 1) US building permits & 2) housing starts.
We teach students how to factor in these events, and to see them as the
institutions do (as opportunities to add to existing positions). Notice that
price broke above the "event candle", then on the retest, algorithms were
activated and orders to buy came in to drive the market higher.
Very predictable.

We may post another chart tonight or tomorrow, then we will close this
thread, since there have been no comments or further interest

Best of Luck
 

Attachments

  • Tuesday 11-19.PNG
    Tuesday 11-19.PNG
    96.7 KB · Views: 7
Last edited:
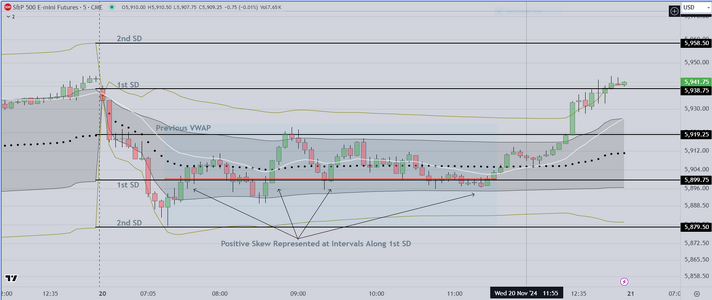
This is a Markup of today's price action

We suggest readers consider the following;

1) Notice how the red line (which creates the "Skew") is right on the black line (1st Standard Deviation)
This creates a positive skew, which signals skilled traders to get long, not just at one place but repeatedly
along that line. This doesn't happen by chance. The institutions that control the market use this methodology

2) What is the lesson that struggling traders can take from this? I think it is clear, that big institutions use "trading range days"
like this to stage inventory prior to a move. Those of us who have been doing this for a while know, that in the near future
price is going to break out. While we can't know with certainty which way, we can observe and trade the pullbacks

3) Finally those who know how to evaluate "structure", are looking for the "tells". A "tell" is a term coined by professional poker
players. It suggests that there is a price behavior that can telegraph which way price will breakout. Some of us use "Supply" and
"Demand" zones, some use other methods. We teach clients to use a combination of data, and we base our work on a weekly
analysis, where we look at "What Worked" (previously). Interestingly, this never fails. that is to say, it always shows us what has
worked recently, and that is usually, what works in the near future. In other words, markets tend to continue to do tomorrow,
what they did today.

Finally over the last week, we received many inquiries about our next class. As mentioned previously, we provide a questionnaire
and an agenda, so that potential clients/students, can decide whether we are the right resource for them. We hope to start a
new class within two (2) weeks. When that happens, we will stop posting.

Good Luck
 

Attachments

  • Wednesday 20 Nov Markup.PNG
    Wednesday 20 Nov Markup.PNG
    130.3 KB · Views: 5
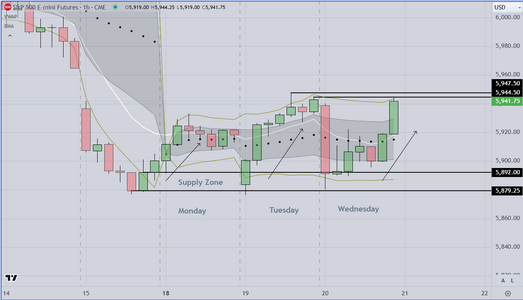
Referencing the previous post, here is a chart that shows how the
higher time frame participants view this week's price action.

Based on experience, we know that big institutions "stage"
inventory, by accumulating positions during an extended period
usually beginning at the start of a week, month or quarter.
This clearly is happening now. The range is clear, and the direction at
this point, higher. This of course can change (based on news or
economic data).

Again from our perspective, it becomes clear early in the week (certainly
at the close of session on Tuesday) that this is the agenda. The "Supply
Zone" was created on Monday, tested on Tuesday, and retested today (Wednesday)
Today, was (as we have said before) predictable. Look at the previous chart
Notice the red line, which suggests a statistical preference for price to move
higher. What we are doing (in our work) is to put the pieces of the puzzle together
ASAP (as soon as possible) prior the open of the next session, then we create our
trading plan and at the bell, we monitor and execute (in a disciplined way). This is
a method that can be taught, but does require effort and discipline. It is not for
everyone and this is the reason why we are selective about who we work with.

We would argue that this is THE difference between amateurs and professionals
At the open, we 1) go in with an idea that has high odds of success. We expect that
2) occasionally we will be wrong and when we are wrong we 3) Identify WHERE we
are wrong, and take action to adjust as necessary.

We will not be posting tomorrow

Good Luck
 

Attachments

  • Supply Zone Example Weekly.PNG
    Supply Zone Example Weekly.PNG
    96.2 KB · Views: 6
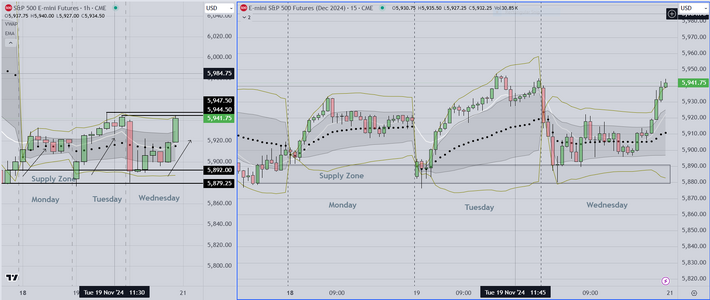
Here is a split screen look at what I was presenting in the
previous post

It shows hourly candles (left side) and 15 min candles on the right side.
The supply zones are essentially the same.

and Finally

Much of what I was taught was based on the idea that how one sees data shapes
the way they make decisions. This is why I posted this last chart. After I have done
my homework, and have a plan in place, I simply slide the display to the left (to the
next session) and begin. Within the first 15 minutes I can see whether my thesis is
going to be correct. This I think is the best method for struggling traders as long as
they are willing to prepare.


Good luck
 

Attachments

  • Split Screen.PNG
    Split Screen.PNG
    165.8 KB · Views: 7
Last edited:
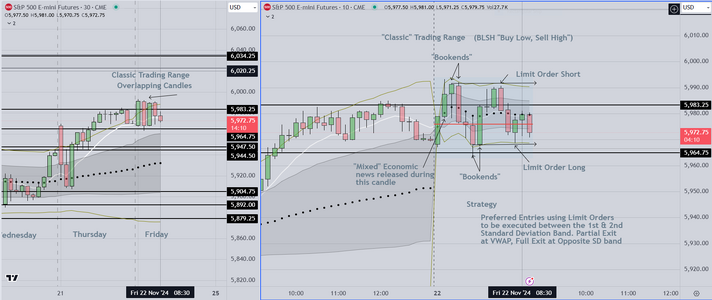
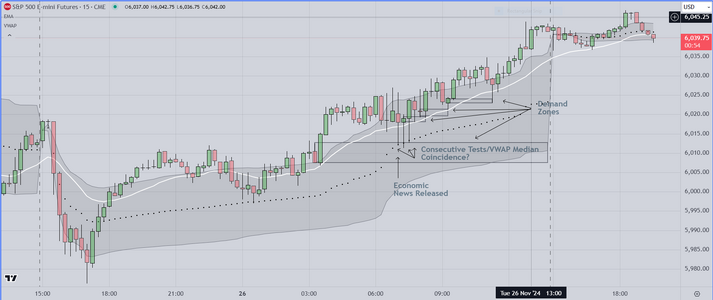
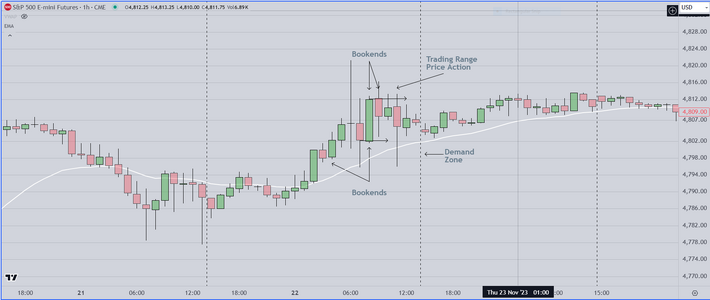
Taking a moment to show what we think of as a "Classic" example of
a Trading Range.

Based on our preparation (what we expected as a result of review of previous
charts) we anticipated a trend day. We were wrong. We took an early loss and
adjusted as follows

1) We took a step back, monitoring price action until we saw the characteristics
typical of a trading range (overlap of candles)
2) We looked at the market response to economic news released at 6:45 PST
and we evaluated that response as "mixed" (both positive and mildly negative
news)
3) We marked the chart to show developing "bookends" (side by side candles)
extending horizontal lines, then using limit orders, we entered at the extremes
exiting in the middle (at the VWAP median). By the 2nd entry, we had erased
our early loss

If there is a "secret" to this, it is that when you are wrong, you have to be self possessed
and willing to re-evaluate your assumptions, without triggering emotion (no recriminations or self scolding)
Time is "of the essence" and one has to adjust to reality (as quickly as possible).
Thankfully, all you have to do is wait for what we call "follow through" bars. IF for example
you are watching an "up" (green) bar, the next bar is the "follow through". IF that bar
simply reverses, you have a potential trading range developing (not trend), and
that calls for the adjustment outlined earlier.

We will wait for price to breakout of the range before taking further entries

Good luck
 

Attachments

  • Trading Range Example Nov 22.PNG
    Trading Range Example Nov 22.PNG
    160.4 KB · Views: 6
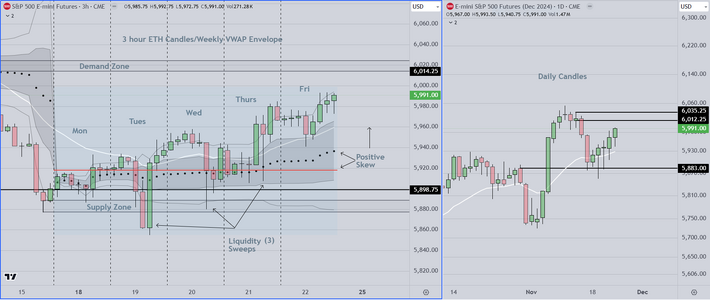
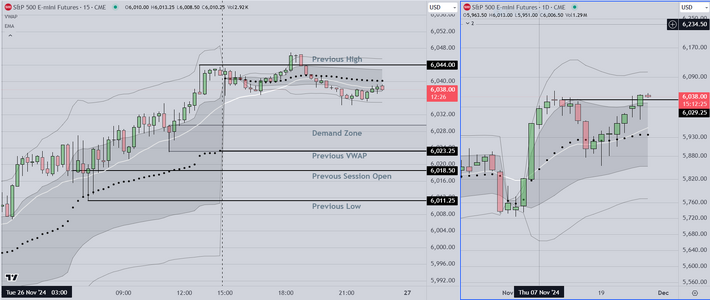
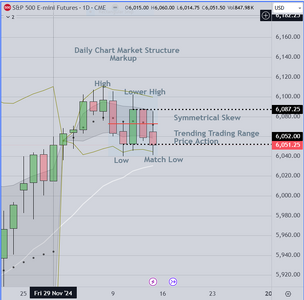
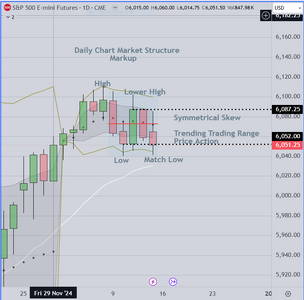
I will be stopping soon, but wanted to post this
longer time frame example.

The chart consists of 3 hour candles on the left side, and the framework is a weekly VWAP envelope
The white line is a 20 period EMA which is not really necessary but I like it.

On the right side we have Daily Candles and the 20 period EMA

What I use this type of display for, is to look for "tells". Examples of "tells" include tests of the Supply & Demand Zones
and "Sweeps" (some older professionals call these "Liquidations" or "Stop Hunts") The purpose is to activate resting orders
and cause a strong reversal. Trades taken at these prices are difficult because they are counter intuitive. On the way down
the bar is red, when suddenly a group of resting limit orders is hit and boom, the market reverses

If you read the previous posts, you can see where I indicate that long entries were going to have higher odds of success
than shorts. Now in hindsight it is easy to see how it played out (and its not over)

Good Luck
 

Attachments

  • 3hour & Daily Candles.PNG
    3hour & Daily Candles.PNG
    134.6 KB · Views: 7
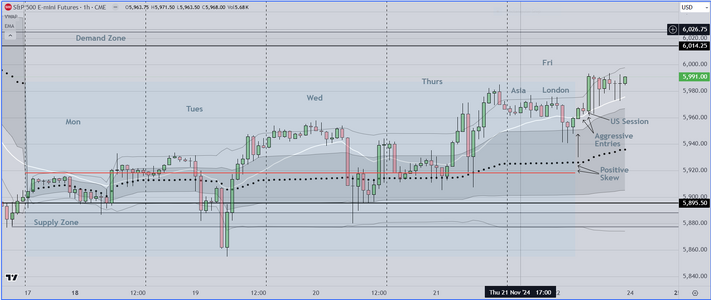
This is my "Post Session" markup for Friday Nov 22 2024

It is particularly important (for me) to learn
more about how I got "trapped" into a long
entry that resulted in an early loss.

In this instance, I assumed (as I was taught) that
the odds favored continuation IF the previous candle
was "strong" ( a WRB, closing on the extreme, in an uptrending
market). In truth, I should have suspected that I was buying
too high in the distribution. As mentioned in previous posts
I took an early loss, then re-grouped to fix the problem.
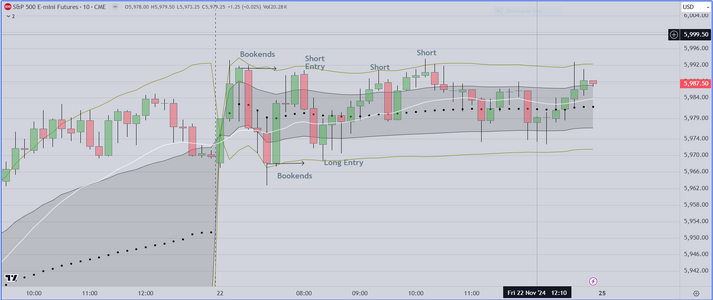
I teach a three (3) step process for this, that is summarized below
and is easy to follow.

Step 1 (Stop & Monitor the Followup candle)

As mentioned, I stopped, and monitored the next candle on a lower
time frame (5 or 10 minute). That "next candle" also known as the "followup
reversed, and I was able to confirm that I was in a "TR" trading range
market, NOT a trending market.

Step 2 (Create New Context)

Monitoring both 5 & 10 minute candles I waited for price to create
"Bookends" (side by side candles up/down or vice versa) and marked
them using a horizontal line. This technique creates a new framework
within which price action either breaks out, or reverses. If price continues
to reverse, that confirms that we have a "TR" trading range environment.
If price breaks out, that confirms a resumption of trending behavior.
This is a simple and effective way to get back on the right side of the
market.

Step 3

Once I identified the price action as "TR" I knew I had at least one (1)
and likely two (2) or three (3) limit order entries available to me. As price
retested the previous "bookmarks". I took them to erase my early loss.

Final Note

Fortunately this does not happen often. Usually I am aware of the price
action in relation to the top of the distribution. This (of itself) is important
because the computer algos that control the market are activated when
price reaches these extremes. Refer to the chart on the right and you can
see that AT THE OPEN price was within reach of the upper VWAP band
Taking the long trade was NOT the problem, HOLDING the position WAS
a mistake, I should have cashed out sooner with a small scalp. THIS was
the real reason I took a loss. An important lesson to learn.
 

Attachments

  • Frdiay Nov 22 Markup.PNG
    Frdiay Nov 22 Markup.PNG
    132.6 KB · Views: 5
  • TR Entries Fri Nov 22.PNG
    TR Entries Fri Nov 22.PNG
    117.3 KB · Views: 5
Last edited:
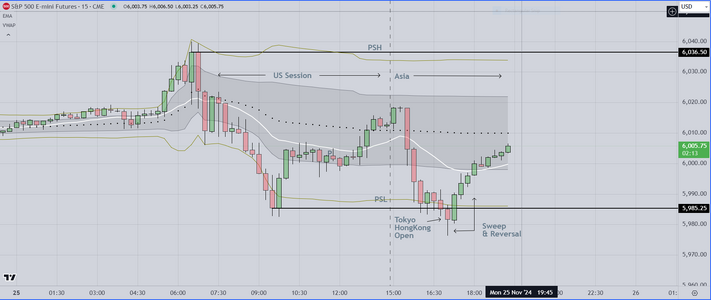
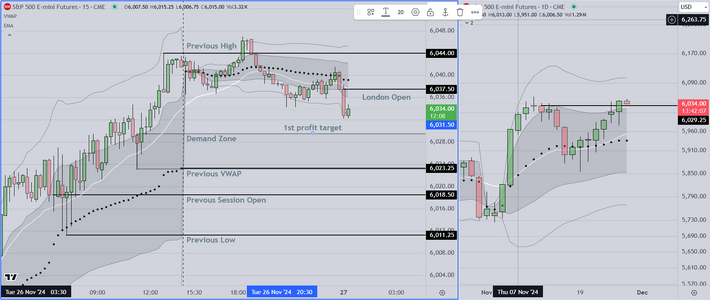
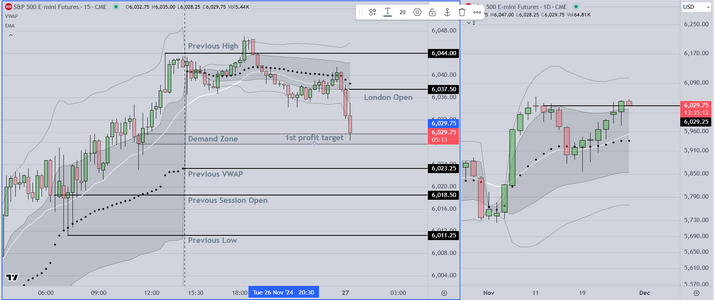
I am going to skip ahead (no US session Markup this time)

Instead I will show a typical "Sweep & Reverse". This occurred
just after the Tokyo/HK open. It's an easy way to enter a trade
with high odds of success. I had nothing else to do so I traded
this one, while eating dinner.

Good Luck
 

Attachments

  • Sweep at Tokyo Open.PNG
    Sweep at Tokyo Open.PNG
    124.5 KB · Views: 2
Top