Morning Raja 1977
Over the last couple of weeks I have been explaining how I work out the LiTS area - for the 2 main Opens from 7 00 am UK time.
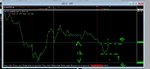
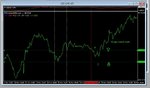
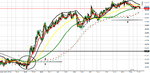
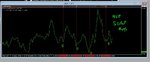
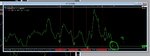
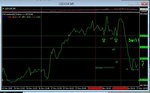
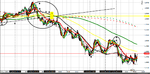
My main indicator of the area is the longer LR's - in fact the longest 3 from approx a 280/ 300 setting up to a 500 LR setting. The actual cross over area of the 3 maybe is the indication of the centre line of the area - but then we have to take into consideration the nearest interim S & R areas closest to the cross overs.
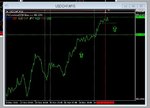
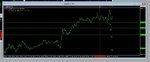
This can mean looking back up to even 12 hrs prior to 7 00 am UK time on a 1 min chart - normally you don't need over 12 hrs - in the majority cases maybe 6 to 9 hrs is sufficient .
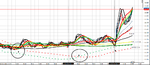
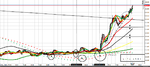
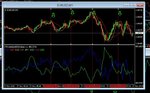
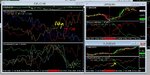
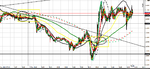
I am going to be playing around some time today at colour coding my charts again to see if they may assist in identifying the cross overs. As I am sure you know we use the 2 ( up to 3 ) quickest LR setting for our scalping - the 3 mid range are for scalp / swing bias and the 3 longers LR setting help determine the session bias - and the session is normally 5 to 8 hrs.
I have found this article by and American trader and author which mentions more about market structure / price actions and even uses the "line in the sand " phrase which might assist you understanding it more
http://adamhgrimes.com/blog/library/market-structure/
Hopefully that might assist along with more examples i will be showing on a revised "traffic light" colour system today and this week. It may feature more than 9 LR's but that's purely due to my own testing and continually assessment of my own methods.
All the best and GL on your trading journey
Regards
F