1-2-3-Formations and Ross Hooks

The discussion re: entry and the success of trading the RH is entirely relevant to the market and product you are trading, if you are looking to trade the FTSE 100 using a spread betting co, intraday then in my opinion you will take losses.

If you are trading the US indices/FX using futures this strategy pays, I know because I trade it and the longest timeframe I use is 5 min.

It is entirely irrelevant what timeframe you use.

If I was to take the time period off the bottom of a chart how many would be able to say if it is a 5 min or a daily, a chart is a chart.

What is important is the size and and risk we are willing to trade and that will vary for each of us.

I would much rather trade 6 contracts with a profit target of 6 ticks on a strategy that will give me atleast 70% winning trades than trade 2 contracts looking for 18 ticks. To me this business is not about making profits, my focus is on not taking losses, but hey thats me and everybody else is going to be different.

I watched Newtron Bomb's video yesterday on the 15 minute breakout , if you are looking to trade the RH check it out in the Knowledge Lab, NB obviously knows what he is talking about and gives excellent commentary to the RH on a breakout from congestion
 
barjon said:
So as 123 and hook trades go I have annotated in green where I think the entries would have occured and circled the entry bars. You would have had around 20 points (potentially) from the first entry and a further 12 maybe from the addition. Spreads notwithstanding of course!!

Just a brief comment; I would have traded the FTSE like jon mentioned.

I'm not sure why you mean about the hook kevin. The 1-2-3 could be categorized as a reversal pattern and the hook as a continuation pattern. You would of course get a higher reward trading the reversal, as you are entering the trend in it's birth, but the hook is seen upon as a low-risk entry/place to add into the trend. Higher risk, higher reward ;) .

I trade both, mostly the hooks, and I've found them to give me nice profits on my quick entries and exits in the american minis. I don't have that many trades a day, so my strategy would'nt fit your trading mentality. What works for some might not work for others.

The message I am trying to get through is that hooks are low risk entries into trending markets. As I didn't really get your arguments on the hooks I am looking forward to your reply.

-Skog
 
One Eyed Shark

I can appreciate that this method works for you and as you say will work on any time frame, I do not doubt that for one moment. It is there for all to see with the chart I posted that it works even on the slow as 'paint dry's FTSE'.

In trading to make a success of it you need something that is a % winner and clearly this is as many set ups are. I have long held the belief that it is easier to take something from the market than try and make megga bugs from taking all the moves or making multiple trades throughout the session for just a point or so.

I place about 2 sometimes 4 trades in a morning and will take small points on some of them. Without realising it until recently I did not realise I was trading the TTE or Hook because I did it anyway from a different set -up.

Skog

I also accept that it is a low risk entry and since finding out about the Hook concept I view these deals with far more confidence than I previously did. As to low risk you only have to look at the 30 min char tif you trade from something like a 5 min or less to see clear examples of good low risk entries each session. It is all about waiting for the right set-up according to your research and your risk exposure and then trading it appropriately according to what you are happy to take. But having a safety plan in your stop should it not work out as expected.

I meant no offence by my comments and did not wish to make people think this was not a worthy method if I thought that I would not be buying the book and posting here. My comments were only observations that for me I use earlier entry methods that do have a good % return of which Hooks form a part when the they are seen. If not I have alternative methods that I can apply.
 
kevin546 said:
I meant no offence by my comments and did not wish to make people think this was not a worthy method...

Hey, where would we be without healthy discussions :cheesy: . As long as there are no personal attacks I am fine with discussing different approaches to this style of trading.
 
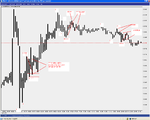
I have attached 2 charts of today's FTSE index the 1 min which I must admit I tend to avoid working from on its own because of many false signals. What of the 1 - 2 - 3 formations identified. I traded the main one this morning which produced 7 points.

The 5 min chart is the one I trade from along with casual looks at the 15 min. There appear less opportunities can anyone help as to the possible formations I have shown or do they fail to meet the appropriate criteria.
 

Attachments

  • FTSE 1min.gif
    FTSE 1min.gif
    27.6 KB · Views: 424
  • FTSE 5 min.gif
    FTSE 5 min.gif
    25.8 KB · Views: 340
I knew I would forget something another question and an alternative suggestion from the 5 min chart posted earlier
 

Attachments

  • FTSE 5 min.gif
    FTSE 5 min.gif
    28.3 KB · Views: 332
Kevin always enjoy your posts :LOL:

Looking at the 5 min FTSE chart.

Dont think I would take the 1st as a 123 #3 looks a bit close to #1 also this way round ( #1 highest ) we are looking for a break to the downside so hook is invalid and a breakout of the low of #3 never gets filled so we are not in the market.

2nd 123 ( blue ) the pattern is very tight, did #3 make a high over the bar that formed #2 ?, if not pattern is not confirmed as a full correction has not taken place i.e. any 1 bar or up to 3 bars providing a higher low and a higher high to the #2 bar. Also the hook is for me, way too close to #2 there is no momentum in the move.

3rd 123 would be a trade for me but I would call it a RH after a breakout from congestion, the #2 being the RH, with a TTE entry at the low of the 2nd bar after the #2.

You can also take the RH you have marked as the 2nd after the breakout and a valid trade, you should have been able to get out of the trade with a small profit.

After the failed RH you can then look for a 123 to the long side with the RH becoming #1.

Oh, this job is so easy in hindsight.............
 
Wanted to show this chart from 3 min AB M5 today

We all see different trades and entries, but this is a 123 entered with a TTE, many traders would have seen this as a Head and Shoulders and been looking to trade a break of the neckline.

The 123 with a TTE got you in and out of the market with a profit while most were still trying to make up their minds.
 

Attachments

  • h&s.JPG
    h&s.JPG
    49.4 KB · Views: 405
After looking at a couple of your charts I see that some of your 1-2-3s are not "Ross 1-2-3s". Joe Ross has a set of criterias the 1-2-3s should fullfill before you can set the numbers on the highs and lows. Re-read the Law of Charts to check what I mean. What you've called 1-2-3s in your charts may be ordinary 1-2-3s, but nothing I would trade...
 
One Eyed Shark

Thank you for giving the FTSE charts a going over. I must apologise as you have gathered I got the 1 - 2 -3 on the wrong way round. I was trying to establish if the 1 min would offer more value with this method than on the 5. It appeared at first to provide more smaller 1 - 2 - 3 which would then offer Hook positions where the 5 min would hide these moves within the wider price moves.

Do you find that on the 1 min chart there are 2 many rogue bars and better to get into a set -up where the price is clearer and has formed the positions from good price sequence.
 
Hi Kevin546

I think that you will find it much more effective it you take your 1-2-3 formations at the end of trends in the same way that Joe Ross teaches. Rather than in a non-trending market. The probability of a profitable trade will be increased.

The reason the probability is higher, is due to the thoughts in the heads of the traders when the formation is being made. There is nothing magical about a 1-2-3 formation, but it is showing signs of the market psychology and trader actions in a trending market.
 
ardhill

I could not agree more and it is the main signal I follow the only difference being I use it as a trend change signal but do not wait for point 2 to be taken out. Provided there is support for the new move after the trend line has been breached and one of the last resistance points in the previous trend has been broken by the creation of point 2 them I am happy to enter.

Skog

I take your point and advice.
 
kevin546 said:
ardhill

I could not agree more and it is the main signal I follow the only difference being I use it as a trend change signal ...

No problem, I was just concerned that you mis-understood the formation, and that could be expensive if you were trying to follow the 'rules' for a different sort of signal. But if but have found a way to utilised it this way profitably, then I wish you success.

As long as it works for you, then that is what counts :)
 
Last edited:
ardhill

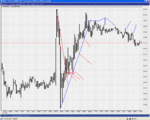
Thank you for your concern. Another chart this time the FX Euro / USD 5 min with examples of Hooks. Chart saved in paint programme but has not come out clearly the diagonal line underneath the Hook is not meant to illustrate the Hook position but the short term trend to generate an entry. The Hook is considered to be the top bar just below the Hook sign.

The 2nd set up the numbers have not come out very well but it should be a selling sequence. Each example should illustrate the 1 -2 -3 formation followed by a Hook with a TTE range and suggested stop if not using a fixed number of pips regardless of the chart.

The 2nd chart is how I see price action before I became aware of Hooks and focuses on the trend change set up which would be entering on a 1-2 -3 formation around this changing process. I have shown just lines this time to indicate entry and further entries or trailing stop dependant on your method while the new trend continues.

In fact there could have been an earlier entry than the one I display on the 1st example when the price dives and then gathers support passing the previous resistance of the earlier trend before the original surge. I have to admit that I have no experience whatsoever of trading this instrument so my comments are obviously made after the facts and from a background of what I use on the FTSE. The 2nd chart is not posted to imply others should follow this or it is the way to trade Hooks. It is there just as a comparison. I intend to use the Hook method in the future either to remain in a trend or to re-enter a trend.

What I find compelling is how different methods display how others will trade that can reinforce your own existing methods. As a day trader I find it is better to sit back and let the day unfold with good safer opportunities appearing after the 1st 45 - 90 mins which can set you up for most of the morning.

Maybe someone can tell me if the Hook examples in the 1st chart are correct formations or am I still making errors.

Regards

Kevin
 

Attachments

  • FX.PNG
    FX.PNG
    59.8 KB · Views: 422
  • untitled.GIF
    untitled.GIF
    59.4 KB · Views: 404
kevin546 said:
The Hook is considered to be the top bar just below the Hook sign...


...Maybe someone can tell me if the Hook examples in the 1st chart are correct formations or am I still making errors.

Hi Kevin

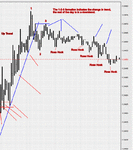
Your chart Is not entirely clear to me, but it looks like all your hooks are 'high bars' on chart 1, including the later part of the day. High bars are fine in an uptrend, but not in a down trend. A Ross Hook is the bar that goes to the local extreme in the direction of a trend eg, the local low in a down trend and the local high in an up trend, just before the price pulls back.

So in a downtrend the lowest bar just before the market rallies is the Ross Hook.

IF I have read your chart wrongly, my apologies.

I have modified the later part of the day in your chart.

The1-2-3 formation was able to signify the change in trend direction.
 

Attachments

  • Kevins Chart.gif
    Kevins Chart.gif
    35.4 KB · Views: 473
Ardhill, only the two/three last instances on your chart are Ross Hooks. A hook must come after a brekout of the #2 on the 1-2-3, or a breakout of congestion.

The 1-2-3 you have noted in your chart isn't confirmed before late on your chart. If you used the TTE on the 1-2-3 you would have gotten an ok entry but it would kill you to wait that long before the 1-2-3 was confirmed. Ross uses a timestop, which would have kicked in in this example.

(P.S That's not a 1-2-3 I would have traded...)

-Skog
 
ardhill

Thanks for reply. When I prepared the post the 1st chart the one saved as png and that is the one that puts forward 1-2-3, Hooks and TTE positions although some of the text I placed within the chart has not come out very clear.

When I submitted the post there appears to be only 1 attachment displayed but there are 2 charts to view. The one you selected which appears minimised underneath my post would have been the 2nd example which was not meant to display the Hook but just to compare applying basic trend analysis and possible future entry positions or trailing stops.

If you open the attachment marked png you will see the chart where I have displayed Hook etc positions.

I have to admit that I did not consider the 1st position you have marked as a Hook for the purposes of the TTE because it did not pass point 2, although I did see the 1- 2 - 3 formation before this Hook is seen I will try and attach another chart to illustrate what I mean.

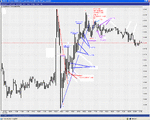
I have attempted to illustrate 1 -2 -3 and Hook formations that take out the previous trend either by the 1 -2 -3 on its own or by including the Hook and TTE position to do so which provide trend change conditions.

Now when I enter a deal on what I refer to as a trend change signal I then hold and try to see out the trend. I take a small % early a fixed sum in the event that the price may not pass point 2 and develop a worthwhile trend. Otherwise I am in and benefit from the move continuing.

When trading the Hook my understanding is that you are entering on a TTE and closing around the Hook if it looks that the price will fail to pass, or you hold on with the trend if it continues.

Considering what follows do you then count the 1-2-3 formations that appear in the trend pass the Hook as new set ups treated in isolation of the original set-up, basically shuffling the 1-2-3 points giving some price positions already used a different number in the price sequence, or do you trade the move as a continuing trend moving your stop appropriately.

I will try and display this in the chart attached using Blue text as the secondary considerations and purple for 2nd selling. Would welcome your comments.

ps Chart not come out very clear so with regard to my last question moving the I have shown the old position 3 as new position 1 and repeated the 1-2-3- formation from there to provide new Hooks and TTE's. Can the Hook concept be used like this or is this incorrect and better that once a Hook set-up is seen at the trend change stage to then manage an entry from the TTE and run with the trend according to your method of profit and exit.
 

Attachments

  • untitled.GIF
    untitled.GIF
    66.2 KB · Views: 1,353
GBPUSD played out very similar to EURUSD.
I attach my charts with my reading of the move on Fri.
 

Attachments

  • long3.gif
    long3.gif
    10.3 KB · Views: 479
  • long5.gif
    long5.gif
    14.6 KB · Views: 555
Naz

I can see from your charts of the EURUSD how support became resistance and then support again illustrating important levels. I can also see the entry set-up from your 2nd chart. What would be of help is for you to explain the Hook in your 1st chart as I only see the relevance in terms of holding onto your long once this level is broken on the upside. I do not see how on the 1st chart it aids your long entry, other than the price has completed 2 price moves of equal distance or around 60 points each suggesting a mirror range that has reached its end when the 2nd is completed which I can relate to. What I cannot see is the Hook signal you present but then I am a novice when it comes to the JR Hook concept. I am fine on trends, support and resistance and general price movement.
 
OK

I accept the issues with the Ross Hooks I pointed out that formed before the number 2 point on the 1-2-3 was taken out. If my recollection is correct, Joe Ross needs the no2 point to be taken out, before he will qualify that move as a trend, thus no 'pointy places' are Ross Hooks till a trend is established, so I stand corrected on that, I should have remembered.

In my endeavour to simplify what can be quite confusing at times, I simplified a little too much and left out one of the 'rules'.

I do find it interesting that something quite as simple as a Ross Hook can be complicated. Not only is there obvious confusion on this thread, but I also find Joe's book on the Ross Hook a bit abstract at times too.

Kevin I can now see how you are using the 1-2-3 formation as a trend indicator, it is interesting that we can see different things in the same chart. It's a bit like my comment in the previous sentence, what is totally obvious to one person, is hidden to another.

It also looks to me like you have gotten the Rh idea just fine, providing that I know what it is :)
 
Top