1-2-3-Formations and Ross Hooks

One Eyed Shark, I enjoy your charts, they are very educational and clear. Thanks for sharing.

One Eyed Shark said:
Nice 123 printed on 2min YM today also confirmed by 5 min @10.00 EST, good for a few points in either timeframe

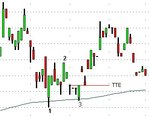
Trying to get the hang of this. Would you mind confirming that this is what you were refering to, or am I seeing thing wrongly? You might in fact be refering to the smaller formation right before what I have marked, different direction?
(Chart is YM 2 mins, the 1-bottom was at 15:12 GMT.


All the best...
 

Attachments

  • YM 2M.jpg
    YM 2M.jpg
    22.4 KB · Views: 339
One Eyed Shark

Out of curiosity have you considered applying the Hook method to incorporate the opening period using data from the previous day. It would appear to have some possibilities on the FTSE. There is some scope for the pattern within the intraday chart although these signals are not seen very often on an instrument that tends to have a narrow daily range although they do appear. However over longer periods they are appearing when some trends have last 2 or more days using the 15 min so far. Not as yet traded it but observing.

Anyway I know you tend to use lower time frames but have you ever considered a 1 -2-3 Hook formation that is seen to be developed towards the close of a session and continue at the open the next day. I know it is said that it works in all time frames so I would assume it has merit or is it risky to join such signals together during what maybe considered the risky 30 minute swing season.

I have attached 15 min chart for the last 2 days see what you make of it.

Regards

Kevin
 

Attachments

  • big.gif
    big.gif
    27.8 KB · Views: 331
Jyde

Have attached my chart looks nothing like yours :|

Entry was @ 14.59 GMT or 09.59 EST dont know how that affects you in Portugal ?

Kevin

I take previous days data but the market has to work through the signal point not gap through in my rules, if no gap open then previous days data is good .(unless 123)
 

Attachments

  • tuesday.JPG
    tuesday.JPG
    36.1 KB · Views: 343
One Eyed Shark said:
Jyde
Have attached my chart looks nothing like yours :|

Entry was @ 14.59 GMT or 09.59 EST dont know how that affects you in Portugal ?

Ha, I guess it was the same thing that confused me for some reason. Actually, our charts are - as they should be - the same. Where you have your no 1 is the first bar on my chart.

(One of the things I was relieved about when I moved down here from the Uk is that it is actually the same time zone - just the weather is distances better :) )

Anyway, thank you for showing me!
 
OES

I can see from your chart this was a good sell but I am a little lost to see it as a Hook or TTE entry. If it is do you think you could explain it as far as I can see it is a simple 1-2-3 reversal where the up trend is broken between 1 & 2 and 3 creates the lower top, which is how I trade. I thought you went for TTE's only.
 
Are so on this occasion you went for the TTE on the failure of 3 before 2. Was this because of the trend break and expecting the gap to be filled. As I understand your previous comments this would not have been suitable for consideration for the Hook method entry as you entered earlier.

Therefore which is wise you have more guns up your sleeve and subject to conditions do enter on a simple 1-2-3 set-up. Basically this set-up is very common and seen towards the end of a trend but then you don't need me to tell you that. The concept of the gap being filled is a popular one. Did this get support for moving back up once the gap had been tested.
 
Kevin

I dont take into account the trend break or gap being filled that is just too much information.

Just trade the patterns, keep your trading simple, always enter with TTE on 123/RH and you will make money.
 
This is my take on these formations, though I'm not sure it's exactly the way others see them.

A 123 TTE is primed for action when a potential "3" bar has been confirmed by subsequent bar(s).

In the case of a 123 top there must be both a LH and a LL (printed within 3 bars) than the potential "3" bar. The bottom of this bar plus one tick can then be sold. The pattern is invalidated if any bar pokes above the 3 point though.

In the case of a 123 bottom there must both a HL and a HH (printed within 3 bars) than the potential "3" bar. The top of this bar plus one tick can then be bought. The pattern is invalidated if any bar pokes below the 3 point though.

The RH TTE following a 123, ledge or congestion breakout is somewhat simpler. After the RH has been confirmed with a pullback bar up to two more pullback bars are allowed for potential TTEs.

One Eye is this how you play these patterns? I've started trading them like this off a 5 min chart, looking for reversals after a decent trend and the results are encouraging, though I still have much work to do on the targets and position sizing. Stops are more obvious, there's really only two choices per pattern. I believe you look for 6 points off a 2 min chart so perhaps I should be looking for 12 or so off the 5 min? Test and refine test and refine test and ... :)
 

Attachments

  • RH.jpg
    RH.jpg
    41 KB · Views: 515
OES

Ok I see that 123 RH with TTE is the format required to follow this method correctly. In your last chart I could not see that and as you have said this was a 123 with TTE.

I ask not to be awkward but to try and understand. If there is no Hook then you applied a different or adapted method, absolutely nothing wrong in that at all and as I have already said I would have played it that way but for different reasons. It would just be nice to understand why you went for a different set -up and why such a set-up should override the Hook. If I am missing something I apologise.

On the matter of keeping things simple I could not agree more with you and sometimes wonder if we are all sometimes guilty of this. We apply different methods and yet sometimes just going with the trend can pay. Again I only post this chart not to challenge the Hook method but as an observation. How often have you been waiting for a set up to develop only for the existing trend according to your time frame to continue from one day to the next with simple profit if the trend was followed.

The attached chart is of the FTSE 15 min over 3 days (2 plus part of this morning). I have added simple trend lines to show for the next day an early deal just by following the trend and being prepared to take something from this move can pay. This is something else I use to help me start the new day. In fact it will from the longer time frame be a simple 1-2-3. This was just an observation not a suggestion to follow or replace the Hook method.

Regards


Kevin
 

Attachments

  • FTSE 15m.GIF
    FTSE 15m.GIF
    24.2 KB · Views: 1,025
Frugi

I agree entirely with your analysis of the 123 pattern and RH.

Slightly disagree on TTE on 123 though your explanation is valid.

On the 123 high on your chart I would enter a sell stop limit one tick below the bar that produces the #3, the assumption being that if the next bar takes out the high of #3, the pattern is invalid and the order is not fillled, or if the next bar fills the limit order you are in the market and the LL of the #3 bar criteria has been met by fact that the order is filled.

This gets you in a few ticks earlier.

Kevin

In the YM chart from yesterday there was no valid hook to trade , the hook would come after the breakout of the #2 point , and yesterday we entered into congestion at this point
 
frugi said:
This is my take on these formations, though I'm not sure it's exactly the way others see them.

A 123 TTE is primed for action when a potential "3" bar has been confirmed by subsequent bar(s).

In the case of a 123 top there must be both a LH and a LL (printed within 3 bars) than the potential "3" bar. The bottom of this bar plus one tick can then be sold. The pattern is invalidated if any bar pokes above the 3 point though.

In the case of a 123 bottom there must both a HL and a HH (printed within 3 bars) than the potential "3" bar. The top of this bar plus one tick can then be bought. The pattern is invalidated if any bar pokes below the 3 point though.

The RH TTE following a 123, ledge or congestion breakout is somewhat simpler. After the RH has been confirmed with a pullback bar up to two more pullback bars are allowed for potential TTEs.

One Eye is this how you play these patterns? I've started trading them like this off a 5 min chart, looking for reversals after a decent trend and the results are encouraging, though I still have much work to do on the targets and position sizing. Stops are more obvious, there's really only two choices per pattern. I believe you look for 6 points off a 2 min chart so perhaps I should be looking for 12 or so off the 5 min? Test and refine test and refine test and ... :)

Even though this post was for OES, I would like to make a comment to your attachment...

The TTE is a way to enter the move as early as possible. On your charts you enter after the low of the lower low has been broken.

Why not enter one tick below the low of the LH bar or the #3 bar (As shown on the edited charts)? By setting your sell stop right below the #3 you enter the move exactly at the point when a LL is being made. An early entry, just the kind the TTE was developed for.

The same goes for the 1-2-3 low.

This is the way I use the TTE. Enter the move as early as possible and exit with a profit of a tick or two if the move shows itself to be false.

This one also goes out to the more experienced OES for comments.

-Skog
 

Attachments

  • Frugi.jpg
    Frugi.jpg
    28.9 KB · Views: 485
Last edited:
One Eyed Shark said:
Frugi

I agree entirely with your analysis of the 123 pattern and RH.

Slightly disagree on TTE on 123 though your explanation is valid.

On the 123 high on your chart I would enter a sell stop limit one tick below the bar that produces the #3, the assumption being that if the next bar takes out the high of #3, the pattern is invalid and the order is not fillled, or if the next bar fills the limit order you are in the market and the LL of the #3 bar criteria has been met by fact that the order is filled.

This gets you in a few ticks earlier.

Kevin

In the YM chart from yesterday there was no valid hook to trade , the hook would come after the breakout of the #2 point , and yesterday we entered into congestion at this point

Oh, OES beat me to it :eek:

Well, he did confirm my statements, so I'm ok...

-Skog
 
... or if the next bar fills the limit order you are in the market and the LL of the #3 bar criteria has been met by fact that the order is filled.

That is very neat indeed OES. Wish I'd though of that. Thanks.

Skog I'll get back to you in a minute :)

Edit: Ah it looks like you''ve both said the same thing. Excellent! Most helpful, cheers.
 
Skog............. :cheesy:

Think we posted at the same time "Great minds and fools........." etc

Kevin

Just taken a look at yesterdays YM chart again, I think I understand where you are coming from.

Yes there is a RH trade after the #1 point that would have been profitable and would have been a TTE @861.

The reason I do not take it is that I will only take a RH if there has been no gap at the open, if there is a gap I am looking for reversal trades 123/candlestick.

These are just my rules not JR and suppose I mentally filtered the trade without giving it consideration.

Hope this clarifies.
 
Frugi

Very good post, well done.

OES

Thank you for explanation, I still feel I need some more work on that one.

As to your comments on Fruigi's 1-2-3 all makes practical sense. Do you apply the same approach to a bar that forms point 3 that is long bar or decide to wait in these circumstances for something nearer. I have to admit with my approach up to now I have gone for the 1st sign of a bar not being able to pass point 3 see entering closer to the top or waiting for a break of the bar bottoms using the bar that formed point 3 to start the trendline. Applying that to Frugis chart a lower bar would enter on close of the bar after 3 or during the 2nd when base bar trend has broken. Your method make sgood sense because you are already prepared while the market could suddenly jumped down while I am waiting to get my order in.

Can anyone explain why the pattern should not be considered if the TTE is not seen within 3 bars. Does the 4th bar often throw up a false move against your position only to offer a better entry position or is it just less reliable from that point on.
 
Maybe I am missing the point here, but I have to ask:

If you enter on the LL - 1 of the 3 bar,wouldn't this be very premature in case that the following bar goes up and takes out non only the 3 but also the 1 bar?
I guess what I am still wrestling with is the concept of - when using the TTE, not otherwise - of why is a 123 a 123 reversal pattern when it at that stage as easily could be a RH in the opposite direction? Or vice versa? Do you know what I am getting at? It is very easy to see when the pattern is done but how do you decide on one or the other as the bars are unfolding?
I know this is basic and I have probably misunderstood something fundamental, but I have been over the law of the charts and I can't find anything to answer my dilemma.

All the best.
 
kevin546 said:
Can anyone explain why the pattern should not be considered if the TTE is not seen within 3 bars?

Joe Ross thinks of it as possible congestion if there is no TTE within three bars. If I remember correctly he says something about that in one of his free PDFs. Either the TLOC or the TTE PDF.

-Skog
 
Jyde said:
I guess what I am still wrestling with is the concept of - when using the TTE, not otherwise - of why is a 123 a 123 reversal pattern when it at that stage as easily could be a RH in the opposite direction? Or vice versa? Do you know what I am getting at? It is very easy to see when the pattern is done but how do you decide on one or the other as the bars are unfolding?

Jyde, you're not the only one with this problem. I hate it when I use the TTE on a RH and then the RH evolves to a 1-2-3 and takes out my stop.

After my stop has been taken out I'm not very eager to jump right in again and the 1-2-3 runs and runs without me on board. :(

I'm trying to look at the price bars that form the patterns and their volume to see how much strength and weakness there are present, but this is easier said than done :cheesy: .

-Skog
 
Last edited:
Skog & Jyde

I view this slightly differently in order for point 3 to have been formed there has to be another bar after it. Therefore if this new bar is below point 3 then this is not the first reference point taken to confirm the possibility of a position.

If we go back to the chart we are looking to trade a reversal of the trend. Point 3 is the high of the existing trend. This means that prices for whatever reason failed to accept that price. The price retraces and then gathers support from a lower position. Some might cause the price to go up again thinking the trend maybe continuing, you takes your chance but the later you get onto a trend the greater the risk of failure.

Anyway as the price fell back we see that the immediate or short term trendline was broken. THe price than gathers support from the lower position forming point 2. The price then rises to form position 3 which in the case in question was lower than point 1. What OES is doing is getting in as close as reasonable to the next failure and the decision is based on the fact that prices have already failed to hold above this level and therefore failing at point 3 suggests that over this sequence the prices are not holding and we are witnessing minus development.

While it does not form part of the Hook Method I also see it as a break of the trend with a lower top created underneath the extended trendline. This provides a method that relates to what was support (previous trendline ) now becoming resistance (new trend). It is something that appears often at trend changes rather than within a trend so works best when the existing trend has matured after a reasonable time or covered a good price distance. IMHO.

As to taking the entry you have your stop close so that should it not work you do not lose much and you are relying on the fact that the method applied has been tested and has a higher probability of success than failure. No method works every time, it is how you take your profit that any method ensures a greater success because many methods get you in only for the price to react after a few points profit. So you have to trade according to this in order to get a greater number of trades that do move in the right direction as profit rather than 'give backs' IMHO.
 
Top