Can anyone point me in the right direction on this one.
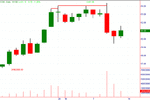
It is a chart of Gold. The Hook and correct 1-2-3 formations have been shown in black.
I am not familiar with this instrument so do not know if the price axis of 1 point is actually 1 point or represents moves of 100 like indices.
Anyway can anyone tell me why save for the alternative 1-2-3 formation being to narrow for this time frame as to why the 1-2-3 and Hook which breaks the trend, why the selected 1 or 3 could not form a TTE in its own right.
I will understand if the point range is to narrow, if on the other hand the price axis is in 100's as in the case of the Dow cents then I would consider that range suitable. It certainly was a good trend buy because you have something to aim for with the old test of the down trend marked in brown already on the chart to work from.


