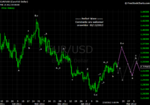
Perfect Wave - 2012-1/2

snowrider

Well-known member
Messages
423
Likes
3
I am starting a new thread for 2012's first half year (Jan - Jun), including EUR, SP, Gold, and JPY. My previous wave counts can be found from:
http://www.trade2win.com/boards/us-indices/136478-perfect-wave-2011-q4.html

Elliott Wave reference can be found from:
Elliott Wave Principle - Wikipedia, the free encyclopedia

My labeling for wave degrees in different time frames:
Monthly - [[]], [[[II]]], [[[III]]], [[[IV]]], [[[V]]], [[[A]]], [[]], [[[C]]]
Monthly - [], [[II]], [[III]], [[IV]], [[V]], [[A]], [], [[C]]
Weekly - , [II], [III], [IV], [V], [A], , [C]
Weekly - I, II, III, IV, V, A, B, C
Daily - 1, 2, 3, 4, 5, a, b, c
Daily - _1, _2, _3, _4, _5, _a, _b, _c
Hourly - __1, __2, __3, __4, __5, __a, __b, __c

My labeling for wave formation in a segment = Wave Name + Wave Formation
For example, [A3] = 3 segments in a wave [A]
For example, [A3][B3][C5] = 3-3-5 formation for waves [A][C]

My labeling for zigzag is the combination of R.N. Elliott's classical labeling and my wave formation labeling. DO NOT USE R.P.'s W-X-Y(-X-Z) labeling because it creates confusion and lacks the flexibility of changing wave counts.

I am getting lazy on updating the counts because I don't know how many people are following. I might stop writing this at anytime. If you are an audience of my threds, please PM me to let me know so that I won't forget to keep you updated if I stop writing.
 
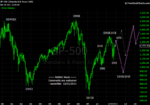
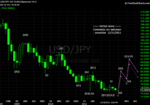
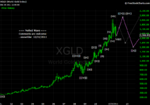
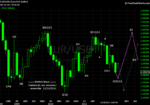
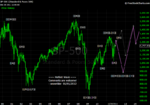
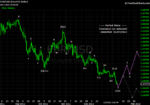
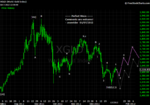
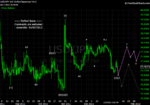
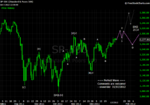
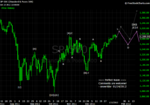
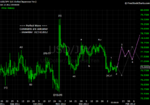
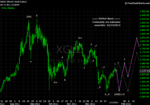
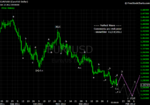
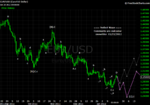
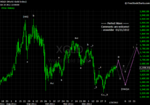
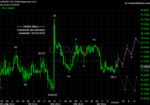
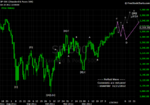
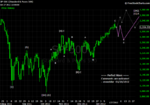
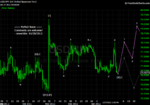
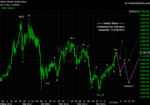
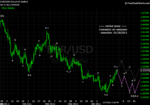
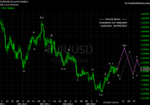
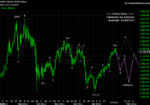
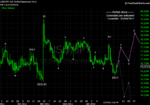
01/01/2012 Monthly Charts

Comments are welcome!
 

Attachments

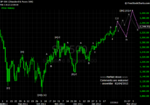
  • 20111231 SP - Monthly.png
    20111231 SP - Monthly.png
    44.5 KB · Views: 7,928
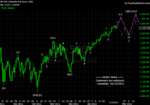
  • 20111231 JPY - Monthly.png
    20111231 JPY - Monthly.png
    43.7 KB · Views: 7,698
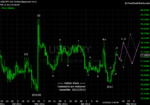
  • 20111231 Gold - Monthly.png
    20111231 Gold - Monthly.png
    38.5 KB · Views: 7,756
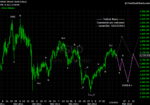
  • 20111231 EUR - Monthly.png
    20111231 EUR - Monthly.png
    43.1 KB · Views: 7,715
interesting..your elliot count for the sp is exactly how i think the year is going to play out..going by other methods to ew
 
I just noticed that I had a typo in gold's month chart.

The final target of gold's super bull market could be $1,960. The extension wave [[[V]]].[[IX]] should be labelled as [[[V]]].[[E]].[IX].
 
where does your count put the highs in on the sp? i reckon we are going to 1330 ish before trading down into the summer making a decent bounce into end of year
 
where does your count put the highs in on the sp? i reckon we are going to 1330 ish before trading down into the summer making a decent bounce into end of year

Rothschild - I would guess that SP spot index 1320 area could be where the reversal starts. We need to pay attention if SP ever moves to that area to see if there is any sign of exhaustion.
 
01/01/2012 SP Monthly Chart Again

01/01/2012 SP Monthly Chart Again

An alternative count:

[[[A]]].[[C]] becomes [[[[IV]]]]
[[]] becomes [[[[V]]]]
[[[C]]].[[C]] becomes [[[A]]]
[[[D]]].[[C]] becomes [[]]
If this is the scenario, we are in [[[C]]] now, and it could go to 550-650 when it finishes.
 

Attachments

  • 20120101 SP - Monthly.png
    20120101 SP - Monthly.png
    46 KB · Views: 8,191
Waves [[[A]]]-[[]]-[[[C]]] are not 3-3-5. [[[A]]] is definitely a 3. [[[C]]] is highly possible a 3 too. [[]] could be a 3 or a 5 depending on how we see it.
126884d1325473343-perfect-wave-2012-1-2-20120101-sp-monthly.png


[[[D]]] and [[[E]]] are part of [[[[IV]]]], where the assumption is that they are in a wave-4's abcde triangle. (See above chart.)

The purple line has the assumption that [[[A]]]-[[]]-[[[C]]]-[[[D]]] have completed, and now we are in [[[E]]] to form [[[[IV]]]]. An alternative count is that [[[A]]]-[[]]-[[[C]]] has completed the [[[[IV]]]], and we are in the early stage of [[[[V]]]].
 
01/08/2012

Comments are welcome!
 

Attachments

  • 20120107 EUR - Daily.png
    20120107 EUR - Daily.png
    47.1 KB · Views: 5,649
  • 20120107 Gold - Daily.png
    20120107 Gold - Daily.png
    48.3 KB · Views: 5,706
  • 20120107 JPY - Daily.png
    20120107 JPY - Daily.png
    47.3 KB · Views: 5,572
  • 20120107 SP - Daily.png
    20120107 SP - Daily.png
    43.4 KB · Views: 5,801
20120109 DJIA Worst Scenario


Quote from jas_in_hbca:

Long term EW count question.

Could 1987 be a end of wave 1, (approx) 2000 end of wave 3,
2008 end of wave 5 ?

If so, then could 2009 bottom be wave A , 2011 top end of a 'B' ?
and where would a projected wave C end ?

Thanks !


jas_in_hbca - It could be. As I believe and mention many times that anything is possible.
With that scenario, we are going to enter a long term bear market soon.
That bear market could have 2.5 more years to go, and it's final destination of the bear movement will be after falling below 2009's low.

attachment.php
 
01/14/2012

Comments are welcome!
 

Attachments

  • 20120114 SP - Daily.png
    20120114 SP - Daily.png
    43.7 KB · Views: 4,078
  • 20120114 JPY - Daily.png
    20120114 JPY - Daily.png
    46.3 KB · Views: 4,074
  • 20120114 Gold - Daily.png
    20120114 Gold - Daily.png
    49.4 KB · Views: 4,107
  • 20120114 EUR - Daily.png
    20120114 EUR - Daily.png
    46.8 KB · Views: 4,092
01/21/2012

Comments are welcome!
 

Attachments

  • 20120121 EUR - Daily.png
    20120121 EUR - Daily.png
    47.6 KB · Views: 3,797
  • 20120121 Gold - Daily.png
    20120121 Gold - Daily.png
    46.5 KB · Views: 3,812
  • 20120121 JPY - Daily.png
    20120121 JPY - Daily.png
    47.1 KB · Views: 3,797
  • 20120121 SP - Daily.png
    20120121 SP - Daily.png
    43.8 KB · Views: 3,752
i agree with your projections on gold, but im not sure your wavecounts match mine. i like to keep it simple, so i only use waves 1-5 and then abc.

...

nim1984- Thanks for commenting and sharing your thought. Yes, I like your idea of keeping it simple. That is also one of the reasons that I don't agree RP's wave counts most of the time.


...

i think wave 5 of wave A was over at 1522, assuming 1920 was end of wave 3. right now we're in wave B which could go as high as 1760 area. then wave c will break to new lows...maybe mid 1300's?

then we'll have the last wave 5 which will take out the high of 1920, but dont have a projection for it.

note: i'm not an elliott wave junkie. i did this analysis in 10mins looking at monthly chart, just to get a feel for where we are right now in the cycle.

Your scenario is quite possible. In that case, this big ABC correction is in the same degee as that of 2008 one. For now, no matter whether we are in a big ABCDE or a big ABC, the medium long term's momentum is heading up.
 
01/28/2012

Comments are welcome!
 

Attachments

  • 20120128 SP - Daily.png
    20120128 SP - Daily.png
    42.9 KB · Views: 3,331
  • 20120128 JPY - Daily.png
    20120128 JPY - Daily.png
    47.1 KB · Views: 3,327
  • 20120128 Gold - Daily.png
    20120128 Gold - Daily.png
    48.6 KB · Views: 3,307
  • 20120128 EUR - Daily.png
    20120128 EUR - Daily.png
    46.6 KB · Views: 3,305
for gold, you're saying that the c wave might have ended. you have wave a from 1522-1662, b wave from 1662-1625, and c wave from 1625-1738.

however your c wave is only 113 pts long, compared to wave a's length of 140.

c waves are often longer than a waves, going upto 1.618 times wave a, so why do you think c wave will be truncated this time?

nim1984 - Good point! We don't know if wave-c has finished yet. That was just my guess because GCG12 is rolling over to GCJ12 now. Sometimes a reversal occurs around futures contracts' rollover dates.
 
02/04/2012

Comments are welcome!

P.S., I'll be out of town next week and won't be able to respond any PM or comments.
 

Attachments

  • 20120204 EUR - Daily.png
    20120204 EUR - Daily.png
    43.6 KB · Views: 2,001
  • 20120204 Gold - Daily.png
    20120204 Gold - Daily.png
    47.4 KB · Views: 2,039
  • 20120204 JPY - Daily.png
    20120204 JPY - Daily.png
    47 KB · Views: 2,077
  • 20120204 SP - Daily.png
    20120204 SP - Daily.png
    46.2 KB · Views: 2,620
02/12/2012

Comments are welcome!
 

Attachments

  • 20120212 SP - Daily.png
    20120212 SP - Daily.png
    45.8 KB · Views: 1,760
  • 20120212 JPY - Daily.png
    20120212 JPY - Daily.png
    46.5 KB · Views: 1,692
  • 20120212 Gold - Daily.png
    20120212 Gold - Daily.png
    47.8 KB · Views: 2,833
  • 20120212 EUR - Daily.png
    20120212 EUR - Daily.png
    45.3 KB · Views: 1,760
Top