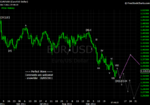
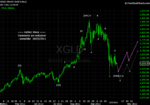
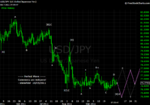
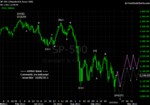
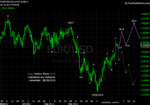
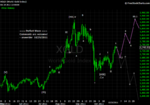
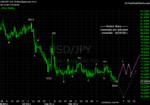
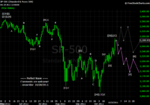
Perfect Wave - 2011-Q4

snowrider

Well-known member
Messages
423
Likes
3
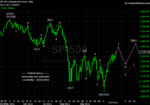
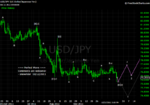
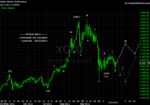
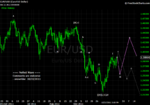
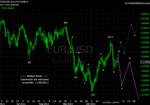
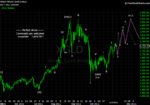
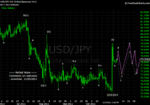
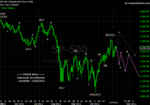
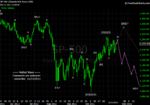
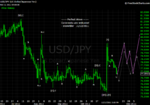
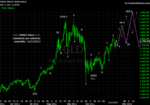
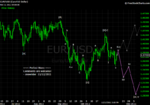
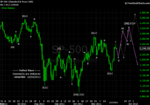
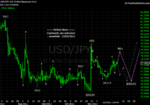
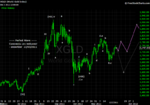
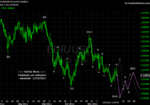
I am starting a new thread for 2011 Q4 (Oct - Dec), including EUR, SP, Gold, and JPY. My wave counts of last quarter can be found from:
http://www.trade2win.com/boards/us-indices/129120-perfect-wave-2011-q3.html

Elliott Wave reference can be found from:
Elliott Wave Principle - Wikipedia, the free encyclopedia

My labeling for wave degrees in different time frames:
Monthly – [[]], [[[II]]], [[[III]]], [[[IV]]], [[[V]]], [[[A]]], [[]], [[[C]]]
Monthly – [], [[II]], [[III]], [[IV]], [[V]], [[A]], [], [[C]]
Weekly – , [II], [III], [IV], [V], [A], , [C]
Weekly – I, II, III, IV, V, A, B, C
Daily – 1, 2, 3, 4, 5, a, b, c
Daily – _1, _2, _3, _4, _5, _a, _b, _c
Hourly – __1, __2, __3, __4, __5, __a, __b, __c
 
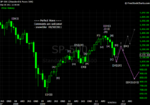
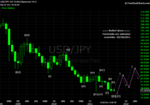
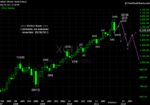
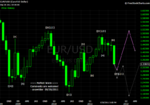
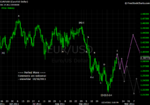
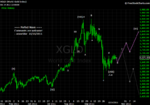
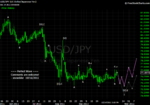
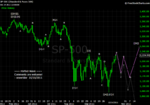
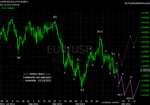
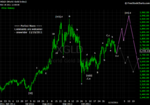
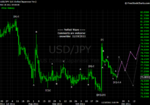
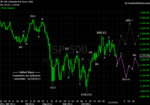
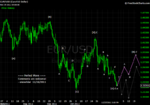
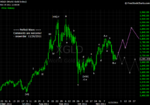
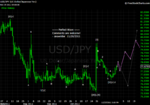
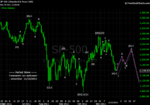
10/01/2011 Monthly Charts

Comments are welcome!
 

Attachments

  • 20110930 SP - Monthly.png
    20110930 SP - Monthly.png
    45.6 KB · Views: 6,677
  • 20110930 JPY - Monthly.png
    20110930 JPY - Monthly.png
    43.3 KB · Views: 6,445
  • 20110930 Gold - Monthly.png
    20110930 Gold - Monthly.png
    40.3 KB · Views: 6,468
  • 20110930 EUR - Monthly.png
    20110930 EUR - Monthly.png
    41.4 KB · Views: 6,466
10/05/2010

Comments are welcome!
 

Attachments

  • 20111005 EUR - Daily.png
    20111005 EUR - Daily.png
    45.8 KB · Views: 3,645
  • 20111005 Gold - Daily.png
    20111005 Gold - Daily.png
    46.7 KB · Views: 3,730
  • 20111005 JPY - Daily.png
    20111005 JPY - Daily.png
    47.7 KB · Views: 3,680
  • 20111005 SP - Daily.png
    20111005 SP - Daily.png
    47 KB · Views: 4,416
10/16/2011

Comments are welcome!
 

Attachments

  • 20111016 EUR - Daily.png
    20111016 EUR - Daily.png
    44.8 KB · Views: 3,338
  • 20111016 Gold - Daily.png
    20111016 Gold - Daily.png
    49.1 KB · Views: 3,381
  • 20111016 JPY - Daily.png
    20111016 JPY - Daily.png
    49.1 KB · Views: 3,425
  • 20111016 SP - Daily.png
    20111016 SP - Daily.png
    47.1 KB · Views: 4,353
Would you say the S&P 500 will be about 1160 by the end of this week ?
 
Would you say the S&P 500 will be about 1160 by the end of this week ?

Pat - I know that you are very good at weekly guessing (that I cannot beat). My guess of SP cash index for the close of 10/21/2011 (Friday) is 1165 if you want me to make a guess.
 
Pat - I know that you are very good at weekly guessing (that I cannot beat). My guess of SP cash index for the close of 10/21/2011 (Friday) is 1165 if you want me to make a guess.

Thanks - hope you will have a go on the weekly comp ?

Nice graphs
 
Last edited:
10/22/2011

Comments are welcome!
 

Attachments

  • 20111022 SP - Daily.png
    20111022 SP - Daily.png
    45 KB · Views: 2,861
  • 20111022 JPY - Daily.png
    20111022 JPY - Daily.png
    45.6 KB · Views: 2,831
  • 20111022 Gold - Daily.png
    20111022 Gold - Daily.png
    47.1 KB · Views: 2,840
  • 20111022 EUR - Daily.png
    20111022 EUR - Daily.png
    42.9 KB · Views: 2,836
10/29/2011

Comments are welcome!
 

Attachments

  • 20111029 EUR - Daily.png
    20111029 EUR - Daily.png
    45.4 KB · Views: 2,276
  • 20111029 Gold - Daily.png
    20111029 Gold - Daily.png
    50.3 KB · Views: 2,346
  • 20111029 JPY - Daily.png
    20111029 JPY - Daily.png
    50.3 KB · Views: 2,335
  • 20111029 SP - Daily.png
    20111029 SP - Daily.png
    48.5 KB · Views: 2,337
It's not Elliott Wave?
There are two forecast lines, one grey and one purple, which one you will trade on?
Also, for SPX why you are sure 1285 will be reversal point?
How did u decided each wave's amplitude? by Fib?
Sorry for so many questions.
 
11/01/2011 Gold Intraday

Comments are welcome!
 

Attachments

  • 20111101 Gold - Intraday.jpg
    20111101 Gold - Intraday.jpg
    125.7 KB · Views: 2,114
It's not Elliott Wave?
There are two forecast lines, one grey and one purple, which one you will trade on?
...

jackypw - Good questions! It *IS* Elliott Wave! The purple line is my preferred count, and the grey line is my alternative count. I trade on the purple line. If the market goes against my assumption, then the grey line takes over becomes my preferred count.

...
Also, for SPX why you are sure 1285 will be reversal point?
...

It is not 1285 the "reversal point", but actually 1295 area (Thursday's hi was 1293) was the reversal point. Why? You won't believe if I tell you that was just my guess. If you really want a reason (out of many reasons), then here is one... The selloff in July officially started from falling below 1295. When the market surged back to that area last week, people lost their mind and forgot where the big selling was from.

...
How did u decided each wave's amplitude? by Fib?
Sorry for so many questions.

There are some rules in EW Principle. For example, wave-3 won't be the shortest. Of course, Fibonacci number plays a very important role on predicting turning points.
 
11/05/2011

Comments are welcome!
 

Attachments

  • 20111105 EUR - Daily.png
    20111105 EUR - Daily.png
    43.8 KB · Views: 1,466
  • 20111105 Gold - Daily.png
    20111105 Gold - Daily.png
    49.4 KB · Views: 1,408
  • 20111105 JPY - Daily.png
    20111105 JPY - Daily.png
    52.4 KB · Views: 1,441
  • 20111105 SP - Daily.png
    20111105 SP - Daily.png
    47.3 KB · Views: 1,447
11/12/2011

Comments are welcome!
 

Attachments

  • 20111112 SP - Daily.png
    20111112 SP - Daily.png
    46.4 KB · Views: 1,262
  • 20111112 JPY - Daily.png
    20111112 JPY - Daily.png
    53.5 KB · Views: 1,261
  • 20111112 Gold - Daily.png
    20111112 Gold - Daily.png
    50.9 KB · Views: 1,305
  • 20111112 EUR - Daily.png
    20111112 EUR - Daily.png
    45.7 KB · Views: 1,254
11/17/2011 SP Intraday

Comments are welcome!
 

Attachments

  • 20111117 SP - Intraday.jpg
    20111117 SP - Intraday.jpg
    130.4 KB · Views: 1,341
11/19/2011

Comments are welcome!
 

Attachments

  • 20111119 EUR - Daily.png
    20111119 EUR - Daily.png
    45.7 KB · Views: 1,416
  • 20111119 Gold - Daily.png
    20111119 Gold - Daily.png
    50 KB · Views: 1,380
  • 20111119 JPY - Daily.png
    20111119 JPY - Daily.png
    50.9 KB · Views: 1,382
  • 20111119 SP - Daily.png
    20111119 SP - Daily.png
    47.1 KB · Views: 1,923
11/23/2011 SP Intraday

Comments are welcome!
 

Attachments

  • 20111123 SP - Intraday.jpg
    20111123 SP - Intraday.jpg
    130.6 KB · Views: 1,470
11/26/2011

Comments are welcome!
 

Attachments

  • 20111126 EUR - Daily.png
    20111126 EUR - Daily.png
    44.6 KB · Views: 1,172
  • 20111126 Gold - Daily.png
    20111126 Gold - Daily.png
    48.3 KB · Views: 1,121
  • 20111126 JPY - Daily.png
    20111126 JPY - Daily.png
    50.9 KB · Views: 1,163
  • 20111126 SP - Daily.png
    20111126 SP - Daily.png
    47.9 KB · Views: 1,580
12/03/2011

Comments are welcome!
 

Attachments

  • 20111203 SP - Daily.png
    20111203 SP - Daily.png
    48.8 KB · Views: 1,353
  • 20111203 JPY - Daily.png
    20111203 JPY - Daily.png
    52 KB · Views: 1,247
  • 20111203 Gold - Daily.png
    20111203 Gold - Daily.png
    47.7 KB · Views: 1,180
  • 20111203 EUR - Daily.png
    20111203 EUR - Daily.png
    44.7 KB · Views: 1,275
Top