You are using an out of date browser. It may not display this or other websites correctly.
You should upgrade or use an alternative browser.
You should upgrade or use an alternative browser.
snowrider
Well-known member
- Messages
- 423
- Likes
- 3
10/19/2010
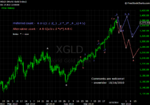
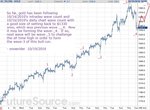
So far, gold has been following 10/14/2010's intraday wave count and 10/16/2010's daily chart wave count with a good size of setting back to $1330 area, which was previous wave-__4. Now it may be forming the wave-_4. If so, next wave will be wave-_5 to challenge the all time high in order to form the wave-3 of this bull run.
So far, gold has been following 10/14/2010's intraday wave count and 10/16/2010's daily chart wave count with a good size of setting back to $1330 area, which was previous wave-__4. Now it may be forming the wave-_4. If so, next wave will be wave-_5 to challenge the all time high in order to form the wave-3 of this bull run.
Attachments
snowrider
Well-known member
- Messages
- 423
- Likes
- 3
10/21/2010
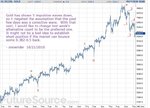
Gold has shown 5 impulsive waves down, so it negated the assumption that the past few days was a corrective wave. With that said, I would like to change last week's alternative count to be the preferred one. It might not be a bad idea to establish short position if the market can bounce some 0.382-0.5 back.
Gold has shown 5 impulsive waves down, so it negated the assumption that the past few days was a corrective wave. With that said, I would like to change last week's alternative count to be the preferred one. It might not be a bad idea to establish short position if the market can bounce some 0.382-0.5 back.
Attachments
snowrider
Well-known member
- Messages
- 423
- Likes
- 3
Re: 10/21/2010
Hi blinx, thanks for sharing. I see what you mean. In SP, there was a 5 weaves up from Tuesday to Thursday. Now we don't know if Friday was forming a correction of that 5-wave-up or was forming a down-moving wave.
same intraday pattern in spx is developing, that crashed the gold.
in fact, it is very close to starting a simlar waterfall in spx. i had not seen that topping similarity before looking at this chart
that was a proper change of count too.
blinx
Hi blinx, thanks for sharing. I see what you mean. In SP, there was a 5 weaves up from Tuesday to Thursday. Now we don't know if Friday was forming a correction of that 5-wave-up or was forming a down-moving wave.
snowrider
Well-known member
- Messages
- 423
- Likes
- 3
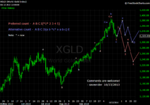
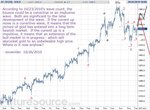
According to 10/23/2010's wave count, the bounce could be a corrective or an implusive wave. Both are significant to the later development of the wave. If the current up move is a corrective wave, it means that the picture of gold has entered into a long term bearish market. If the current up is a impulsive, it means that an extension of the bull market in in progress - which will skyrocket gold to an unbelieable high price. Where is it now anyhow?
Attachments
According to 10/23/2010's wave count, the bounce could be a corrective or an implusive wave. Both are significant to the later development of the wave. If the current up move is a corrective wave, it means that the picture of gold has entered into a long term bearish market. If the current up is a impulsive, it means that an extension of the bull market in in progress - which will skyrocket gold to an unbelieable high price. Where is it now anyhow?
I can't go with the intraday labeling because it is as bullish as you imagine... maybe even more $5,000+. But that is probably at least 2 years away.
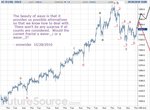
for the count from the peak, the beauty of the waves down to the 22nd low, I count as abc then d up, and now the e is finishing.
for me, the question is, 'was that all just the A?' and now we get a B up? or is it just like every other correction for weeks, the quick lovely waves (lots of overlaps too) that turn back higher?
The QE II thing ought to make the gold run higher. But it may only spike in a B retrace. So I'm for now on the side of further correction in coming weeks ... until proven wrong! 🙂 i have to stay flexible.
Then much higher next year.
snowrider
Well-known member
- Messages
- 423
- Likes
- 3
I can't go with the intraday labeling because it is as bullish as you imagine... maybe even more $5,000+. But that is probably at least 2 years away.
for the count from the peak, the beauty of the waves down to the 22nd low, I count as abc then d up, and now the e is finishing.
for me, the question is, 'was that all just the A?' and now we get a B up? or is it just like every other correction for weeks, the quick lovely waves (lots of overlaps too) that turn back higher?
The QE II thing ought to make the gold run higher. But it may only spike in a B retrace. So I'm for now on the side of further correction in coming weeks ... until proven wrong! 🙂 i have to stay flexible.
Then much higher next year.
Hi blinx, I think that today's low completed wave-_b. Because today's setting back, I have ruled out the possibility of any strong bullish movement. Which means that if gold is ever go up to complete a wave-_c (i.e., the corrective wave of last week's impulsive down), it could have a collapse after that.
snowrider
Well-known member
- Messages
- 423
- Likes
- 3
snowrider
Well-known member
- Messages
- 423
- Likes
- 3
This thread is closed. If you are following my wave count, please see:
http://www.trade2win.com/boards/us-indices/107106-perfect-wave-2010-11-a.html
http://www.trade2win.com/boards/us-indices/107106-perfect-wave-2010-11-a.html
Similar threads
- Replies
- 20
- Views
- 6K

