isatrader
Senior member
- Messages
- 2,964
- Likes
- 135
This journal will cover my active trading within my spreadbetting account. The timeframe used is mainly daily charts and weekly charts, with 4 hour charts for entries. Products traded will be Currencies, S&P 500, Gold and Stocks.
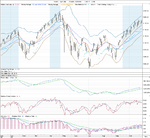
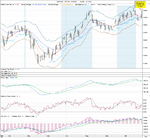
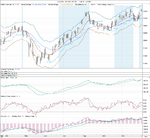
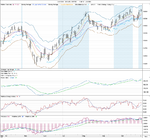
The aim of this strategy is to only play trades with a high probability of success. The indicator rules were chosen to help filter out the volatile sideways periods and to identify a developing trend, which I can hopefully then ride up until being stopped out using a Chandelier Exit stop loss.
I backtested this strategy using just the first four main criteria on FTSE stocks, Commodities, Indexes and a range of Currencies. The top performers were those that had fairly consistent volatility during uptrends and tended to trend the most. This tended to be the major indexes, currencies and gold. So I will focus on trading mainly the S&P 500, Gold and a few currency pairs that I have the risk tolerance in my account for with this strategy.
Daily Buy Signal On Criteria
Long Entry
All of the following MUST be fulfilled to consider a long entry:
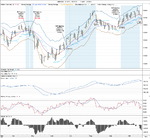
1. Close above the Chandelier Exit (settings: High Period: 22; ATR Period: 22; Time Period: 3)
2. Rising 22 Day EMA
3. Close above Ichimoku Kinko Hyo Senkou Span A Calculation
4. Close above Ichimoku Kinko Hyo Senkou Span B Calculation
Once these criteria have been fulfilled I need to confirm the buy signal using my other favourite indicators.
Daily Indicators
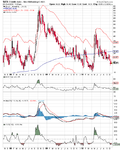
1. Force Index – 10 day cumulative summation line must be above it’s 22 day moving average line.
2. RSI – The 14 day line must be above it’s 9 day moving average line.
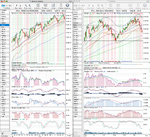
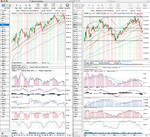
3. rRelative EMA crossover – The 22 Day EMA must be above the 52 Day EMA.
Weekly Indicators
1. rRelative 50 must be in an uptrend. i.e a weekly rRelative EMA must have had a crossover to the upside.
2. Force Index – 13 week force index must be above it’s 9 week simple moving average.
3. RSI – must be above it’s 9 week simple moving average.
Short Entry
This system is mainly suited to uptrends due to their lower volatility as I mentioned before. But if I want to short, the reverse of these settings MUST be in place to consider a short entry. However, from testing it is clear that shorting using this system only works well when trading currencies. But it is not as successful as trading long only, and gives many more false signals.
These are the rules for the system that I aim to follow. I will use other discretionary analysis such as economic data, news events and general market trends as well to help filter out the false signals.
Next Step
If confirmed – Look for entry point
1. Drop down to the 4 hour chart to look for an entry point.
2. Aim to buy in the daily value zone between the 11 Day EMA and the 22 Day EMA.
3. Don’t buy until the 22 Bar EMA crosses above the 50 Bar EMA on the 4 hour chart after a pullback to value.
Stop Loss
1. Initial placement – Safezone Stop setting of 2x average downside penetration. If however, this is above entry point, then check the Average True Range (ATR) and place the stoploss a reasonable distance below based it’s daily range and my acceptable risk per trade. If the risk is greater than 2% of my account value then the trade is not possible. Ideally for currencies the risk should only be 0.5% of my account.
2. Chandelier Exit – once it rises above the initial stop loss update daily to lock in profit.
Elders Money Management Rules
Risk per trade – 2% rule
Trade sizes: Small (0.5% risk), Medium (1% risk), Large (2% risk).
1. Is the trades risk 2% or less?
2. 6% Rule – Stop trading for the rest of the month after hitting a 6% limit of drawdown plus open risk.
Exit Rules
1. Chandelier Exit – automatic stop loss (settings: High Period: 22; ATR Period: 22; Time Period: 3)
2. Safezone Stop (setting of 2.5x average downside penetration) – if the price accelerates away from the Chandelier stop loss and indicators are diverging, then use discretionary safezone stop. Close position manually if it closes below the safezone stop.
It is a fairly simple system at it’s core – basically identify an uptrend, buy at value and follow the uptrend until stopped out. However, it will require a number of discretionary decisions once the buy signal is activated to decide whether the signal is valid or not to help filter out the false signals.
My starting account size is £4024.61, so initial maximum stoploss position for 2% risk is £80.49 per trade.
I will aim to trade well below this to begin with, so as to give me time to test the system in real life with only minimal risk to my overall account. As I know spreads can be widened by unscrupulous brokers to stop you out of a trade. I’m hoping my spreadbetting firm won’t do this, but I’d like to be prepared incase they do.
Ok, lets see how I go. I will update the journal once I have my first potential trade in the coming days.
isatrader 🙂 View attachment 94376

