Price goes down, probably
I have no real idea what will happen next! When looking at any chart, I like to put forward an argument that is both bullish and bearish. If one argument is much stronger than the other, then I look to enter a trade accordingly, based upon what price does and which of the two scenarios plays out.
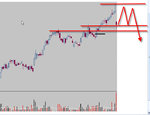
As with WOT 4, the chart is in a clear uptrend, although it doesn’t look strong. Jon’s entry candle is pretty much the only really healthy looking bull candle in the latest move up. Subsequent candles are small and the price closes in the bottom half of the day’s high/low range. The uptrend is still alive - just - but it’s in a pretty poor state. The penultimate candle, with its long upper shadow looks very ominous indeed, and so it proved to be. If I were still in this trade, I would place a stop just below the third green line down, as price may find support here. In theory, this would enable me to exit at break even at worst and, possibly, even with a small profit. If price does drop initially and find support here, I will want to see three things happen to convince me that there is still life left in the uptrend. Failure of any one of these would suggest a possible trend change and certainly indicate an exit from the trade . . .
1. If the price ‘bounces’ off the third green line to create a higher swing low, I would then look for it to progress up through the blue trendline and beyond the high (and open) of the last candle – marked by the heavy green line. If price finds resistance at these two points and turns back south – effectively following the red line on the chart – then it will have made a new lower swing high, which could mark the start of a new downtrend.
2. If price does regain its lost ground and move back above the trendline and take out the last high/open, the next objective would be to fill the gap between the last candle and penultimate candle. This would provide some reassurance that the sudden large gap down was just a ‘blip’ in proceedings - an overreaction to some event or other - and that normal trading activity is now resumed.
3. Lastly, to be completely convinced that all is well and that the uptrend is back on track, I will look for a shallow retracement on low volume confirming the validity of the up trendline. If all three conditions are met, I might consider adding to my position at this point. Lastly, a move up to new highs and a higher swing high will then need to be made.
The flip side of this coin is, on balance, more probable IMO. As stated earlier, the trend appears to be faltering. I suspect that the traders buying over the last few weeks are what mr. Marcus would call ‘weak hands’. They are buying off the pro’s who accumulated their holding long ago near the start of the chart. As a rule of thumb, I assume that pro’s accumulate the bulk of their holding at or near the start of a trend and not at the latter stages of one. In fact, this is the point at which the pro's seek to sell (in an uptrend) to the handful of late players (weak hands) who think – or hope and pray – that there is still life left in the trend.
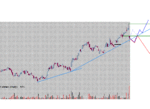
Clearly lots of traders have been tempted to buy during the final candle, evidenced by the massive volume and the fact that price closed way above the half way mark. There may be a continuation of this buying pressure over the next few days, and traders who opened positions at Jon’s earlier entry point will be buoyed up by this action and may even add to their positions. If price then retraces on low volume (following the dotted blue line), then it ought to find support at or around the juxtaposition of the heavy green line and the blue up trendline. Failure to do so would see stops being hit left, right and centre, day traders piling into new short positions and a likely waterfall in price, much harder and faster than the red line down on the chart suggests.
Tim.


