You are using an out of date browser. It may not display this or other websites correctly.
You should upgrade or use an alternative browser.
You should upgrade or use an alternative browser.
Wallstreet1928 Analysis & live calls on FTSE,DAX,S&P...aimed to help New traders
- Thread starter wallstreet1928
- Start date
- Watchers 252
- Status
- Not open for further replies.
Dentalfloss
Legendary member
- Messages
- 63,404
- Likes
- 3,726
Dentalfloss
Legendary member
- Messages
- 63,404
- Likes
- 3,726
Dentalfloss
Legendary member
- Messages
- 63,404
- Likes
- 3,726
wallstreet..
s500.at 847 res.fine
you must allow for some overshoot,on the days when there is alot of testosterone
the reversal should be confirmed with a divergence or dmi/up movement tailing off
just my opinion
s500.at 847 res.fine
you must allow for some overshoot,on the days when there is alot of testosterone
the reversal should be confirmed with a divergence or dmi/up movement tailing off
just my opinion
Dentalfloss
Legendary member
- Messages
- 63,404
- Likes
- 3,726
Dentalfloss
Legendary member
- Messages
- 63,404
- Likes
- 3,726
Dentalfloss
Legendary member
- Messages
- 63,404
- Likes
- 3,726
francisfinley
Established member
- Messages
- 902
- Likes
- 46
weekend analysis
Hi all. This is my weekend analysis.
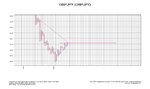
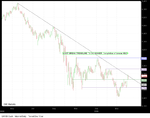
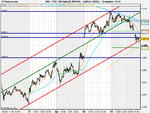
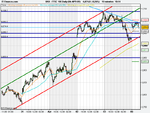
In the 2 FTSE charts here you can see we are on the monster trendline.
You will also see that this is a massive inverse H&S coming down the trendline. Essentially the descending triangle formation will breakout lower as depicted in the black chart. I am not sure, even with the huge bullish momentum we will go past 4160 just yet as 4200 is a resistance area.
If you are slightly more bullish. You can see there is also another inverse H&S where the right shoulder now starts to be put in. One would have thought we breakout over the monster trendline upto resistance @ 4330 to complete this move and put that shoulder in. After this in the black chart the scenario is bounce off 4330 down to 4000 and then bounce.
Afterwhich you can see 4670 ish would be the triple top in and then buy the pullback for that puppy as it will be liftoff like the nasdaq did this week.
enjoy.
Hi all. This is my weekend analysis.
In the 2 FTSE charts here you can see we are on the monster trendline.
You will also see that this is a massive inverse H&S coming down the trendline. Essentially the descending triangle formation will breakout lower as depicted in the black chart. I am not sure, even with the huge bullish momentum we will go past 4160 just yet as 4200 is a resistance area.
If you are slightly more bullish. You can see there is also another inverse H&S where the right shoulder now starts to be put in. One would have thought we breakout over the monster trendline upto resistance @ 4330 to complete this move and put that shoulder in. After this in the black chart the scenario is bounce off 4330 down to 4000 and then bounce.
Afterwhich you can see 4670 ish would be the triple top in and then buy the pullback for that puppy as it will be liftoff like the nasdaq did this week.
enjoy.
Attachments
Dentalfloss
Legendary member
- Messages
- 63,404
- Likes
- 3,726
francis.good analysis
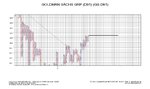
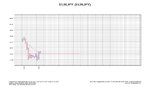
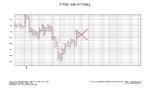
here is the p/f equivalent.
box size is 1% by 3 reversal
i have taken the bearish resistance line in red from the previous retrace and not the spike.
price has crossed this line and now the bullish support line /blue is in control
trendlines are always dran at 45 degrees,although freehand ones are also drawn
price always crosses the trendline,when there is a long consolidation
there is a vertical count of 4450 taken from the first move off the low
that is the p/f interpretation of the chart
Attachments
wallstreet1928
Legendary member
- Messages
- 6,609
- Likes
- 89
Hi all. This is my weekend analysis.
In the 2 FTSE charts here you can see we are on the monster trendline.
You will also see that this is a massive inverse H&S coming down the trendline. Essentially the descending triangle formation will breakout lower as depicted in the black chart. I am not sure, even with the huge bullish momentum we will go past 4160 just yet as 4200 is a resistance area.
If you are slightly more bullish. You can see there is also another inverse H&S where the right shoulder now starts to be put in. One would have thought we breakout over the monster trendline upto resistance @ 4330 to complete this move and put that shoulder in. After this in the black chart the scenario is bounce off 4330 down to 4000 and then bounce.
Afterwhich you can see 4670 ish would be the triple top in and then buy the pullback for that puppy as it will be liftoff like the nasdaq did this week.
enjoy.
very good analysis francisfinley
I can have a break now.....!!
wallstreet1928
Legendary member
- Messages
- 6,609
- Likes
- 89
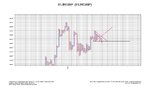
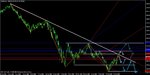
FTSE - 1 week 1 hr chart
Strategy for monday
scenario 1 - wait for confirmation above 4100(downward sloping light blue trend line broken) and then I will go long with a trailing stop loss up to 4120, 4130 , 4140 with an eye on a break out above 4140 up to 4200
scenario 2 - If 4100 fails to hold (downward sloping light blue trend line) then i will go short to 4050- 4030
we have failed to get past 847-846 on S&P so it should be an interesting week ahead
Good rally in the financial sector with the likes of Goldman Sachs, Citi and JP Morgan, I expect the rally to resume
Attachments
puregold24carat
Active member
- Messages
- 159
- Likes
- 4
Yes the rally should continue as i think DJ headed towards 8375 and thus will pull FTSE with it.
wallstreet1928
Legendary member
- Messages
- 6,609
- Likes
- 89
Goldman sachs breaking on the upside
I am long Barclays 172 .......stop loss 165
target 180
Good morning chaps
I have taken profit on Barclays as target met @ 179.8
wallstreet1928
Legendary member
- Messages
- 6,609
- Likes
- 89
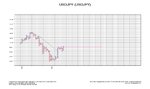
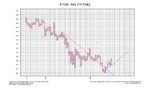
intra day 10 min chart analysis
2 light blue lines are in play here
I have been asked to elaborate and I will be more than happy to
hrizontal light blue line - has been intraday support for the last few days and therefore is important for today as well around 4070
if 4070 breaks then we go down to gap fill to 4030
2 light blue lines are in play here
I have been asked to elaborate and I will be more than happy to
hrizontal light blue line - has been intraday support for the last few days and therefore is important for today as well around 4070
if 4070 breaks then we go down to gap fill to 4030
Attachments
Last edited:
Dentalfloss
Legendary member
- Messages
- 63,404
- Likes
- 3,726
wallstreet1928
Legendary member
- Messages
- 6,609
- Likes
- 89
i shorted 4061 to 4033 then my nerve went.
Well done
haha............I bet your kicking yourself for not holding your position!
welcome to the world of trading my friend
dr.blix
Senior member
- Messages
- 2,279
- Likes
- 33
Well done
haha............I bet your kicking yourself for not holding your position!
welcome to the world of trading my friend
yup, watched it bomb to 3960, rather disappointing! still, i'm only SB 20p a point so no biggy either way.
great thread btw.
- Status
- Not open for further replies.
Similar threads
- Replies
- 72
- Views
- 19K
- Replies
- 21
- Views
- 7K