You are using an out of date browser. It may not display this or other websites correctly.
You should upgrade or use an alternative browser.
You should upgrade or use an alternative browser.
Wallstreet1928 Analysis & live calls on FTSE,DAX,S&P...aimed to help New traders
- Thread starter wallstreet1928
- Start date
- Watchers 252
- Status
- Not open for further replies.
Dentalfloss
Legendary member
- Messages
- 63,404
- Likes
- 3,726
wallstreet1928
Legendary member
- Messages
- 6,609
- Likes
- 89
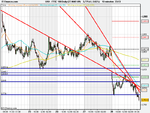
FTSE analysis- trading plan for 31st march 2009
1 week 10 min
too much resistance on the upside
multiple trend line resistance along with 50 & 20 MA ...............Phew!!
that is going to take some strength to pierce it ................but in this current volatile market anything is possible!!
Goldman sachs held up well...I expected more selling!! barclays might be a good buy around 140 tomorrow
but bias is still on the down side chaps until we have S&P go back above 800 level
Oil reached $48.7 ...............oil stock stocks will be under pressure and we all know what that means with an index that is heavily weighted towards them!!!
scenario 1 - if trend lines and MA's taken out(confirmation req'd) then a nice scalp is on the cards by going long up to yesterdays gap down 3835- 3840............
obviously if we take out 3840 then i will be happy to go long up to gap fill 3890
scenario 2 - If we fail to show any interest above 3780 then i am happy to remain short upto 3740 and 3710
Attachments
wallstreet1928
Legendary member
- Messages
- 6,609
- Likes
- 89
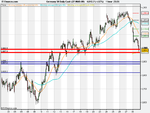
Great wall of china - two red horizontal trend lines must hold and should hold, otherwise it gets nasty
DAX - 1 month 1 hr chart
So what are the germans up to, DAX was bungee jumping today ...........the DAX is becoming like the Dow, a bit too volatile for my liking at present
So I shall refrain from trading it in the interim
DAX - 1 month 1 hr chart
So what are the germans up to, DAX was bungee jumping today ...........the DAX is becoming like the Dow, a bit too volatile for my liking at present
So I shall refrain from trading it in the interim
Attachments
wallstreet1928
Legendary member
- Messages
- 6,609
- Likes
- 89
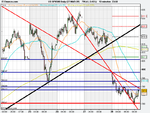
S&P analysis for 31st march 2009
1 week, 10 mins
Going long at 780 play today worked like clockwork ............perrrrrrrfect !!
anyway, we must concentrate on next trade and not get over confident
strategy
scenario 1 - pretty obvious, no real apetite above 780 then I will go short after confirmation(two 10 min candles)
scenario 2 - slightly tricky and more risky , if 789 broken then I will go long and we could have potential to go to gap down level of 798 but 793 could try and put a stop to that but I very much doubt it
if 798 broken then we go to gap fill of 805 and 819
but thats too far ahead
good night all
I hope all the newbies benefit from this
it has taken me 1/2 an hour to do this
Attachments
Dentalfloss
Legendary member
- Messages
- 63,404
- Likes
- 3,726
rather quiet overnight in australian market.index down 0.6%.nikkei down 1.3%
major markets now at important support areas in this uptrend.
there could be quite a few false breaks until people make thei mind up.could even be lo range days
major markets now at important support areas in this uptrend.
there could be quite a few false breaks until people make thei mind up.could even be lo range days
Dentalfloss
Legendary member
- Messages
- 63,404
- Likes
- 3,726
billiton down 2% overnight.could be playing catch up with the eauropean markets
Dentalfloss
Legendary member
- Messages
- 63,404
- Likes
- 3,726
thanks for the charts irastorza.seems like most indices are in line
Dentalfloss
Legendary member
- Messages
- 63,404
- Likes
- 3,726
wallstreet1928
Legendary member
- Messages
- 6,609
- Likes
- 89
I am long FTSE 3807 ...stop loss 3777
scalp
scalp
Dentalfloss
Legendary member
- Messages
- 63,404
- Likes
- 3,726
tight range now 3760-3830
some minor support building at 3800 on the tick chart
some minor support building at 3800 on the tick chart
wallstreet1928
Legendary member
- Messages
- 6,609
- Likes
- 89
I am long FTSE 3807 ...stop loss 3777
scalp
take 2 contracts for 16 points profit and amend 1 contract break even
i bought the close. Stops are in.
Good trading as always guys. catch you tomorrow
Overnight system pays off again.
Covering here for 60 pips 🙂
wallstreet1928
Legendary member
- Messages
- 6,609
- Likes
- 89
I am long FTSE 3807 ...stop loss 3777
scalp
taken last remaining contract profit at 3831
nice scalp as per trading plan last night
wallstreet1928
Legendary member
- Messages
- 6,609
- Likes
- 89
I am now short FSTE 3831 ...............stop loss 3861
scalp
scalp
wallstreet1928
Legendary member
- Messages
- 6,609
- Likes
- 89
Overnight system pays off again.
Covering here for 60 pips 🙂
well done candles, get them points in the bag
- Status
- Not open for further replies.
Similar threads
- Replies
- 72
- Views
- 19K
- Replies
- 21
- Views
- 7K


