Wallstreet1928 Analysis & live calls on FTSE,DAX,S&P...aimed to help New traders

Status
Not open for further replies.
Hi WS,
I am using this method, but the manual method is not working for me in the sense that emotions come into play and I either exit to early or hang on for longer than necessary. Hence the need for an automated setup, that would produce emotion free small but consistent returns. I do a 9-5 IT job as well, so have some programming knowledge. It would be nice to have a simple system running on your PC, whilst one goes about their day job and check on it once in a while.

I will contact minime and let you all know how I progress.

many thanks,

Would be smart to use a demo account to test system
Just a thought :)
 
It's quiet on here this evening! :-0

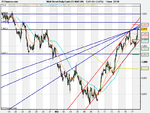
So the FTSE's now at 3910, it's highest since 26th Feb. There's been a lot of talk on various sites about a downwards "wave 5" which should begin before we reach the low of wave 3 (3956).

I'm still long but have reduced my stops expecting the bears to kick in soon. :whistling

What are other people's thoughts on this 5 wave theory?

yes i buy into it and it seems convincing.......
 
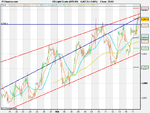
nice channel forming here..............

will it break upwards or come back to trade within
 

Attachments

  • 20.54.png
    20.54.png
    24.2 KB · Views: 128
I suppose if enough people are expecting it to happen, and they all start selling around 3950 (if we get there) there should be a rapid down move. It would be nice to get in at the right time!

Wallstreet, I've been reading this thread since post No.1 with great interest - thanks for all the advice and info. May I ask how often you reach your daily target? Did you hit it today?
 
FTSE ........... 3950!!!!!!!!!!!!!!!!!!!!!!!!!!!!!!

everybody will be expecting that on the morrow

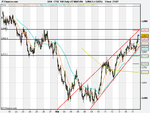
1 month 1 hr chart indicating
 

Attachments

  • 21.09.png
    21.09.png
    23.4 KB · Views: 133
FTSE ........... 3950!!!!!!!!!!!!!!!!!!!!!!!!!!!!!!

everybody will be expecting that on the morrow

1 month 1 hr chart indicating

I drew my lines pretty much exactley as you did there WS! and yes 3950!!!!!

Trendline meets resistence here looking very interesting for tomorrow!

I'm hoping for a bounce off resistence but will trade what I see if i'm at my pc at the time!

Viks
 
I suppose if enough people are expecting it to happen, and they all start selling around 3950 (if we get there) there should be a rapid down move. It would be nice to get in at the right time!

Wallstreet, I've been reading this thread since post No.1 with great interest - thanks for all the advice and info. May I ask how often you reach your daily target? Did you hit it today?

yes I certainly did hit hit my daily target,

I trade 3 contracts per trade so I only need around 60-70 points to get there......

If you check my posts I think I hit around

15 + 28 + 43 = 86 point so yes I got above it

I would always state when I hit my daily target but I have tried to stop doing that now as it can be classed as boasting and is not good for the EGO.

and yes I do hit my target on a regular basis, as traders we all have bad days now and again

I think the people on this thread can check the posts and certainly find out if i had a bad day or not

I have tried to stay away from the US market lately as It is really confusing, European markets easier to read at present !!
 
Thanks for the reply Wallstreet. Unfortunately my work normally prevents me from trading during the day so I'm stuck with longer term stuff mostly.

It would be nice if I could follow your trades during the day so that I could learn your reasons for doing so and pick up some tips to improve my own trading methods. I currently read all the posts at the end of the day whilst looking back at the charts.

Anyway, keep up the good work, I think it's great that you and others on here are happy to show your trades so that newbies like me can learn from you. Thanks!
 
I drew my lines pretty much exactley as you did there WS! and yes 3950!!!!!

Trendline meets resistence here looking very interesting for tomorrow!

I'm hoping for a bounce off resistence but will trade what I see if i'm at my pc at the time!

Viks

keep me updated with your trades my friend , its good to see what other people are doing

keeps you in check
 
wallstreet.great thread
i am still guzeling
nas 100 has broken a retracement column and activated an upside vertical count of 1305.this only brings us to the top end of the consolidation
 

Attachments

  • NASDAQ 100.gif
    NASDAQ 100.gif
    55.8 KB · Views: 122
wallstreet.great thread
i am still guzeling
nas 100 has broken a retracement column and activated an upside vertical count of 1305.this only brings us to the top end of the consolidation

and the famous dentist returns

good to see you back my friend, I have missed your analysis
 
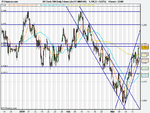
I hate this index because its so volatile and i hardly ever trade it but i think i will in the next few days because the risk reward is pretty high

If 7400 - 7500 doesn't hold and fails we could get a very massive down side(200-300 point on this by risking just 50 points.........)
 

Attachments

  • 22.00 .png
    22.00 .png
    27.3 KB · Views: 148
Last edited:
wallstreet
sorry a slight mistake on the previous chart.it was a 2 box reversal not 3.targets can fall short on the 2 box.but it does give you an idea where some profits should be taken
here is the 3 box.as yet,no count activated
 

Attachments

  • NASDAQ 100.3box.gif
    NASDAQ 100.3box.gif
    51.2 KB · Views: 145
dow
eod data.50 by 3 reversal
if it prints above 7500,then the 9050 count becomes active
 

Attachments

  • DJ INDU AVERAGE.gif
    DJ INDU AVERAGE.gif
    50.2 KB · Views: 125
Status
Not open for further replies.
Top