wallstreet1928
Legendary member
- Messages
- 6,609
- Likes
- 89
you were absolutely spot on.
well done
Last edited:
you were absolutely spot on.
we done
Nice one. Wave 4/5 by the end of the week?
The only thing I see is that the whole market is expecting large amounts of shorts at ~4000...isnt that inviting a squeeze? I'm a novice so...fairly clueless! 🙂
Tonight I demand the finest wines known to humanity...only 4 euros from my local french off license 🙂
opened up a short on barclays again
I am short @ 89..........stop loss 93!!
target 85 .....
Hi there,
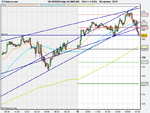
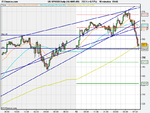
Just want to clarify something about this trade. This is a set-up called a 1-2-3 and has nothing to do with Ellliott Waves. It's purely a trade based around (in this case) an uptrend, followed by a retracement and then a break of the previous high. It has a pretty high probability but the key, IMO, is to make sure you have the R/R spot on - this needed a 55 point stop (text book should have been 95 but I 3767 has been a strong number hence I placed my stop there to lower the risk) but, as you can see, it has returned more than this. If you're interested in 1-2-3's I would recommend having a read of this - http://www.trade2win.com/boards/price-volume/13451-1-2-3-formations-ross-hooks.html as an excellent place to start. You can find these on all time frames and all markets but I never trade lower than 1H and only use it with indices. They do take time to work though so you need to be patient. This one fully retraced and took out my B/E stop but I got another crack at it - the lesson was that I moved my stop up too soon.
Hope this helps
Rob
P.S. Can you send a bottle over this way 🙂
Hi there,
Just want to clarify something about this trade. This is a set-up called a 1-2-3 and has nothing to do with Ellliott Waves. It's purely a trade based around (in this case) an uptrend, followed by a retracement and then a break of the previous high. It has a pretty high probability but the key, IMO, is to make sure you have the R/R spot on - this needed a 55 point stop (text book should have been 95 but I 3767 has been a strong number hence I placed my stop there to lower the risk) but, as you can see, it has returned more than this. If you're interested in 1-2-3's I would recommend having a read of this - http://www.trade2win.com/boards/price-volume/13451-1-2-3-formations-ross-hooks.html as an excellent place to start. You can find these on all time frames and all markets but I never trade lower than 1H and only use it with indices. They do take time to work though so you need to be patient. This one fully retraced and took out my B/E stop but I got another crack at it - the lesson was that I moved my stop up too soon.
Hope this helps
Rob
P.S. Can you send a bottle over this way 🙂
Thanks again Si55AMG!
Every bit of advice helps.
Regards,
Suleman
come US banks shares keep falling, and please take barclays with you on the free fall
haha!!
Hi Rob
Many thanks for the direction and taking the time out to respond like that.
I'll check it out this evening. Do you know what came of the original author, Roberto?
Regards
Richard
ps. I would never trust a french postman with wine 🙂
Hey Wallstreet
What broker do you use? Would your barclays trade have been closed now as its gone 16.30 in UK?
V
nice shorting so far ..........
break out of horizontal support line and i will dive in to short again until 755
I have now bought S&P 755 (200MA) & opening gap support
stop loss 750
I have now bought S&P 755 (200MA) & opening gap support
stop loss 750