You are using an out of date browser. It may not display this or other websites correctly.
You should upgrade or use an alternative browser.
You should upgrade or use an alternative browser.
Wallstreet1928 Analysis & live calls on FTSE,DAX,S&P...aimed to help New traders
- Thread starter wallstreet1928
- Start date
- Watchers 252
- Status
- Not open for further replies.
wallstreet1928
Legendary member
- Messages
- 6,609
- Likes
- 89
I just keep it simple my friend
lo and behold trend line hit and support is found .........can it hold we shall wait and see!!
I use the 10 min chart to confirm my 60 min!!
I need to use it in sync, i will explain it in a bit
I am now short S&P
809.2 ..stop loss 813.2 ...target 805- 804
stop loss hit
this uptrend will just not stop, UUP was building a base and EUR was getting weaker!!
Dentalfloss
Legendary member
- Messages
- 63,404
- Likes
- 3,726
wallstreet1928
Legendary member
- Messages
- 6,609
- Likes
- 89
This rally stinks .........
I did say it was going to be hard trading today
I have now set up a short FTSE 4490 ....1 contract ........stop loss 4700
I have shorted DAX 1 contract 5050 ....stop loss 5150
I am willing to risk £300 of my capital in return for a more than double/triple return!!
lets see how this goes
i am off to sleep now!!
OK chaps .............I have taken profit from the recent drop we have just witnessed .........
total profit from that crazy trade = £150 ..........I got annoyed after my stop loss was triggered and then i watched the S&P go into free fall
My S&P trade was at a loss, direction was right but my timing was not therefore stop loss triggered!!
timing is of the essence my friends ............
Dentalfloss
Legendary member
- Messages
- 63,404
- Likes
- 3,726
looks like the ftse will gap down 1% tomorrow
it already has on ig.4400 support
it already has on ig.4400 support
wallstreet1928
Legendary member
- Messages
- 6,609
- Likes
- 89
looks like the ftse will gap down 1% tomorrow
Yes sit will gap down to pivot S2
Outa my gourd
Member
- Messages
- 98
- Likes
- 1
I don't know - just when i think I'm learning something, I realise how little I know. Frustrating.
dr.blix
Senior member
- Messages
- 2,279
- Likes
- 33
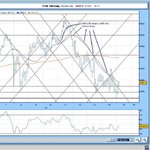
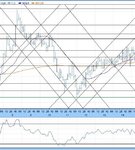
here you go geo (and anyone else who likes kids drawings!), todays and yesterdays geometric FTSE charts:
todays lines are exact copies of yesterdays. as soon as the US markets open they cease to fit, so they start @ 8.00 am and stop @ 2.30 pm.
useless for forecasting future days though, as you need the opening 30 mins to start using them.
todays lines are exact copies of yesterdays. as soon as the US markets open they cease to fit, so they start @ 8.00 am and stop @ 2.30 pm.
useless for forecasting future days though, as you need the opening 30 mins to start using them.
Attachments
Last edited:
Geofract
Experienced member
- Messages
- 1,483
- Likes
- 112
here you go geo (and anyone else who likes kids drawings!), todays and yesterdays geometric FTSE charts:
todays lines are exact copies of yesterdays. as soon as the US markets open they cease to fit, so they start @ 8.00 am and stop @ 2.30 pm.
useless for forecasting future days though, as you need the opening 30 mins to start using them.
Thanks Dr. B
They might not be useless for future days, if say you have some previous data on an H4 & H1chart to use a starting point - just a thought.
What confirmation method do you use to take a trade btw? I'm trying to use pin bar, or bars that show price rejection (so they may not be exact pins) at S/R levels & T lines.
Have you tried candlesticks btw? It's easier to see price rejection IHMO. You can always change the colours to something less immotive if that helps. I often run black & grey candles.
Geofract
Experienced member
- Messages
- 1,483
- Likes
- 112
I found a link for you Dr. B - Alan's Box Trading Method - I haven't read it myself, but at first glance looks like it might relate to your approach. Beware of esoteria though! I'm gonna have a quick read anyway.
dr.blix
Senior member
- Messages
- 2,279
- Likes
- 33
What confirmation method do you use to take a trade btw? I'm trying to use pin bar, or bars that show price rejection (so they may not be exact pins) at S/R levels & T lines.
Have you tried candlesticks btw? It's easier to see price rejection IHMO. You can always change the colours to something less immotive if that helps. I often run black & grey candles.
at the moment i try to look for 2 bar key reversals, and then wait for a retracement respecting an up/down trendline followed by a move up or down past a key point of S or R. if i'm looking for a short in particular i also look for RSI divergence.
problem is i get impatient and get my timing wrong, a lot.
i've not really tried candles properly. just because i've read more about bar chart patterns than i have about candle formations so far.
have to work 2moro, won't be about here, so good luck to everyone for 2moro's trading.
EDIT: thanks geo, i'll have a good butchers at that box trading over the weekend. good luck for 2moro 🙂
Last edited:
Geofract
Experienced member
- Messages
- 1,483
- Likes
- 112
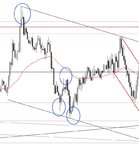
quick pic - wicks and tails of candlesticks show price rejection, though I have admit I don't understand the candle pattern formation yet... I'm just looking for relatively long tails/wicks.
Ignore the TL's, it's a bl**dy mess 🙂
edit: thanks for letting me know your confirmation method DB. I'll have to look into 2bar key reversals, sounds useful.
edit edit: There were really long pins on the H1 today. A pin bar traders dream I suspect.
Ignore the TL's, it's a bl**dy mess 🙂
edit: thanks for letting me know your confirmation method DB. I'll have to look into 2bar key reversals, sounds useful.
edit edit: There were really long pins on the H1 today. A pin bar traders dream I suspect.
Attachments
Last edited:
wallstreet1928
Legendary member
- Messages
- 6,609
- Likes
- 89
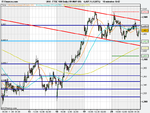
FTSE analysis Thursday 21st May
As I mentioned during the day 4445.................gap fill was a very important level on 10 min and 60 min!!
we are now going to be trading in the congestion zone from 7-12th may.........with potential to go back down to 4300 ............
I expect some support around 4400 level before and if there is another leg down!!
Financials should come under pressure in the morning due to Goldman and JP morgan fall and Mr Obamas plan to curb the credit card companies ............I will certainly be looking to short Legal and general in particular??
keep an eye on US dollar as it continues to dominate
GBP/USD ......................
EUR/USD ......................If these currency pairs rise = dollar getting weaker = markets rise and vice versa
Good Indicator in the current climate and can help with S&R
Attachments
Last edited:
wallstreet1928
Legendary member
- Messages
- 6,609
- Likes
- 89
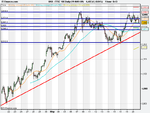
S&P is looking very weak to me
failed retest of 930 ...............next level 884
I have opened up a short 901.2 ...stop loss 904.2
target 892 initially and then 884
US dollar has been severely battered and may well be due a pull back so i will need to keep an eye on that........
a pullback on US dollar or a stall in the US dollar will be enough for me to reach my 1st target of 892
Attachments
Last edited:
wallstreet1928
Legendary member
- Messages
- 6,609
- Likes
- 89
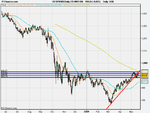
I have also shorted the EURO/USD as looking very top heavy.........potential mini H/S formation on 15 min , 1 week chart
1.3773...stop loss 1.3803
target ............what ever profit i have made up when i wake up in the morning
haha ...........good night!!
1.3773...stop loss 1.3803
target ............what ever profit i have made up when i wake up in the morning
haha ...........good night!!
SuddenDeath
Legendary member
- Messages
- 14,063
- Likes
- 143
good morning everyone, FTSE is there an inverse head shoulders on hourly chart starting on the 7th May , neckline is at 4482ish ?
good morning...thanks for the analysis people ...much appreciated.
Share price - UK share prices, breaking stock market news and share price charts and UK share information.
unfortunately the data us delayed, but i personally would find this break down sector by sector very helpful especiallly if real time.. anyone know of such a thing free on the net?
edit: lol i've known abou this live chart site for some time but obviously not had a good look around.... there's even daily pivot calculator and they are worked out for daily, fib and camarilla as well..
http://www.livecharts.co.uk/pivot_points/pivot_points.php?symbol=^FTSE
not gonna help on the SB charts tho..;-(
Last edited:
wallstreet1928
Legendary member
- Messages
- 6,609
- Likes
- 89
What about usd as a function of vix, any correlation? Is there a symbol for usd index I could use
try FreeStockCharts.com - Web's Best Streaming Realtime Stock Charts - Free
type in "uup" in the symbol area
or try
MarketWatch.com Quote
- Status
- Not open for further replies.
Similar threads
- Replies
- 72
- Views
- 19K
- Replies
- 21
- Views
- 7K