You are using an out of date browser. It may not display this or other websites correctly.
You should upgrade or use an alternative browser.
You should upgrade or use an alternative browser.
Wallstreet1928 Analysis & live calls on FTSE,DAX,S&P...aimed to help New traders
- Thread starter wallstreet1928
- Start date
- Watchers 252
- Status
- Not open for further replies.
Dentalfloss
Legendary member
- Messages
- 63,404
- Likes
- 3,726
dr.blix
Senior member
- Messages
- 2,279
- Likes
- 33
well done Dr.B, and Carlos B - I closed at 4508.
Yeah, we made some points!! lol
sadly my gains are almost eradicated from an earlier 9pt loss, hey ho.
i have a strong up T line that has been respected all morning, hits at 4503, so interested to see what happens there...in fact its on it now.
edit: short 4498, prob regret this!
edit 2: closed for 3 points, nervous about going against the trend. hope it doesn't go down to my target at 4482!
Last edited:
Geofract
Experienced member
- Messages
- 1,483
- Likes
- 112
Volume was very low yesterday, despite the large move north, so quite happy to have bailed at 4508. Feeling a bit suspicious out this going further north, without having a reasonable pull back beforehand. Anyway, GL to all those who are still long.
dr.blix
Senior member
- Messages
- 2,279
- Likes
- 33
edit: short 4498, prob regret this!
edit 2: closed for 3 points, nervous about going against the trend. hope it doesn't go down to my target at 4482!
why didn't i let it run!!
i'm off to have lunch in a huff 🙂
wallstreet1928
Legendary member
- Messages
- 6,609
- Likes
- 89
are we likely to stay above the res line.?
any news coming out soon from the us.?
housing stats...............
MarketWatch.com Story
InTheMoneyStocks - Economic and Earning Alerts
but are they already factored in after yesterday rally???
Geofract
Experienced member
- Messages
- 1,483
- Likes
- 112
what do I do to rectify it?
Did you install the Micrsoft Silverlight component for freestockcharts.com WS? If you can see the charts, then you must have - if you can't see charts, you will need to install the software when it prompts you.
Beyond that, I don't know any fixes.
dr.blix
Senior member
- Messages
- 2,279
- Likes
- 33
hope this works.
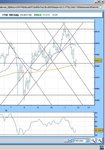
the reason i wanted to show this, is because all the trend lines are derivatives of 2 lines i drew at 8.45 this morning. i've made copies of them all day, and they've constantly been respected (although at one point earlier as support not resistance) they still are, even though you cant see now on the this chart.
the reason i wanted to show this, is because all the trend lines are derivatives of 2 lines i drew at 8.45 this morning. i've made copies of them all day, and they've constantly been respected (although at one point earlier as support not resistance) they still are, even though you cant see now on the this chart.
Attachments
LeoE
Active member
- Messages
- 224
- Likes
- 7
Well I probably shoulda gotten out of my long when you guys did!
Edit: actually, making higher highs and higher lows, could still go northwards
Stopped out 🙄
dr.blix
Senior member
- Messages
- 2,279
- Likes
- 33
hope this works.
the reason i wanted to show this, is because all the trend lines are derivatives of 2 lines i drew at 8.45 this morning. i've made copies of them all day, and they've constantly been respected (although at one point earlier as support not resistance) they still are, even though you cant see now on the this chart.
i'm looking for a short at 4482 or 4490.
Geofract
Experienced member
- Messages
- 1,483
- Likes
- 112
hope this works.
the reason i wanted to show this, is because all the trend lines are derivatives of 2 lines i drew at 8.45 this morning. i've made copies of them all day, and they've constantly been respected (although at one point earlier as support not resistance) they still are, even though you cant see now on the this chart.
Interesting. I have observed the same phenomina (spelling?) where particular angles of inclination and declination are repeated over and over, and often respected as you observe. Keep those charts coming Dr.B, always good to see someone elses perspective.
dr.blix
Senior member
- Messages
- 2,279
- Likes
- 33
i'm looking for a short at 4482 or 4490.
on a 10min TF there was a 2 bar key reversal, but it ran straight back up into my 4482 resistance which knocked it back, but i'm still not sure...feels like we're in no mans land a bit.
think i'll still hold out for 4490 to short/long if it crashes my down T line from earlier.
db better than my charting at the moment mate..in fact it doesnt really exist as yet bar a few pivots.... soemthing i'll hopefully learn from hanging out with the more informed on here and elsewhere.
sorry to her that leo
db may i ask how you come to that conclusion of shorting at those prices plse?. i cant quite make out on the chart
yet again breakout retracement rules obeyed.. made a couple but nowt to speak of..
sorry to her that leo
db may i ask how you come to that conclusion of shorting at those prices plse?. i cant quite make out on the chart
yet again breakout retracement rules obeyed.. made a couple but nowt to speak of..
dr.blix
Senior member
- Messages
- 2,279
- Likes
- 33
something else i've noticed which seems quite important today, on my chart, which is a 5min TF that i've never used before, my 21MA and 125MA are, in places, hitting EXACTLY my S&R and geometric trend lines.
still waiting for 4490, be amazing if it uses my 21MA in line with my down T line as resistance!
still waiting for 4490, be amazing if it uses my 21MA in line with my down T line as resistance!
ouch just realised i should have etered sometime back - shoulda gone short at 4477 during breakout - hi kurumba!! potential 15 pips gone begging there..
no resistance till 4456 on caramilla.. what other daily pivots people got that could be telling ?
db can ask why 21 and 125 settings on ma..?
sorry for all the q's.. just trying to learn.
no resistance till 4456 on caramilla.. what other daily pivots people got that could be telling ?
db can ask why 21 and 125 settings on ma..?
sorry for all the q's.. just trying to learn.
- Status
- Not open for further replies.
Similar threads
- Replies
- 72
- Views
- 19K
- Replies
- 21
- Views
- 7K