You are using an out of date browser. It may not display this or other websites correctly.
You should upgrade or use an alternative browser.
You should upgrade or use an alternative browser.
Wallstreet1928 Analysis & live calls on FTSE,DAX,S&P...aimed to help New traders
- Thread starter wallstreet1928
- Start date
- Watchers 252
- Status
- Not open for further replies.
Geofract
Experienced member
- Messages
- 1,483
- Likes
- 112
ah i was gonna say DJ30 as the chart & price looked familiar lol
s&p - spy correct? looks out to me..with regards to SB firm
I have 'SPY SPDRs S&P 500' - thinking this is the same as inthemoneystocks.com - but yeah, price is quite far out compared to IG... Over to Wallstreet I think 😱
long at 4422 out at 4430
+8 (+9 inc spread)
damn missed a new entry point i should have taken.. too busy with cheese , crackers & coffee
anyone any idea as to when the bulls gonna take a timeout?
just noticed the heading "delayed data" geo on DJ30.. well behind on 5 min TF on Freestock
+8 (+9 inc spread)
damn missed a new entry point i should have taken.. too busy with cheese , crackers & coffee
anyone any idea as to when the bulls gonna take a timeout?
just noticed the heading "delayed data" geo on DJ30.. well behind on 5 min TF on Freestock
Last edited:
Outa my gourd
Member
- Messages
- 98
- Likes
- 1
wow, fascinating FTSE day, i made two bad calls trying to short on osc divergence at key price levels and it just blasted right through.
i hope someone on here went long from 4305 at the open!
I got +11 which I'm v happy with for a first day :clap:
dr.blix
Senior member
- Messages
- 2,279
- Likes
- 33
I got +11 which I'm v happy with for a first day :clap:
n1 omg, glad someone's getting it right 🙂
LeoE
Active member
- Messages
- 224
- Likes
- 7
I got +11 which I'm v happy with for a first day :clap:
Yep, deff a better day than I've just had! 😆😢
Outa my gourd
Member
- Messages
- 98
- Likes
- 1
Yep, deff a better day than I've just had! 😆😢
Sorry, guys. Chalk it up to beginner's luck! :clover:
SuddenDeath
Legendary member
- Messages
- 14,063
- Likes
- 143
if SP500 closes in top 1/4 of today's candle sell ftse100 and u will see sp500 down 10pts tomorrow at which point u should close your ftse short
Geofract
Experienced member
- Messages
- 1,483
- Likes
- 112
I managed to preserve my capital today through supreme trading skill!! yeah right... No, seriously, didn't trade, as I have loads of work to do. Will now look for longs after break above Fridays high.
Well done all those who made some wedge - Bad luck to those who didn't - Watch those OSC Dr.B, I wonder how reliable they are, especially if giving signals which oppose a strong move up or down.
Well done all those who made some wedge - Bad luck to those who didn't - Watch those OSC Dr.B, I wonder how reliable they are, especially if giving signals which oppose a strong move up or down.
dr.blix
Senior member
- Messages
- 2,279
- Likes
- 33
I managed to preserve my capital today through supreme trading skill!! yeah right... No, seriously, didn't trade, as I have loads of work to do. Will now look for longs after break above Fridays high.
Well done all those who made some wedge - Bad luck to those who didn't - Watch those OSC Dr.B, I wonder how reliable they are, especially if giving signals which oppose a strong move up or down.
yeah geo, forgot a very simple osc rule, ignore osc sell signals in a strong trend and ignore osc buy signals in a strong down trend.
half my trouble these days...forgetting the few bits of info i've picked up 🙄
Geofract
Experienced member
- Messages
- 1,483
- Likes
- 112
yeah geo, forgot a very simple osc rule, ignore osc sell signals in a strong trend and ignore osc buy signals in a strong down trend.
half my trouble these days...forgetting the few bits of info i've picked up 🙄
Fortunately there's always another day, and hopefully you can make it all back tommorow.
My biggest issue is I am contrarian by nature, so I always look to make opposite moves to market direction, and somehow I percieve there is no point jumping on a trend, because I think there's not much higher/lower to go for xyz move... how often I am wrong!! I must take time to study all the moves I would have profited from going with the trend, I'm sure I would have made lots of points, and it would have been an easier ride too.
How did you get on today Wallstreet?
cadoganpier
Member
- Messages
- 95
- Likes
- 0
Crickey just added up my tally and am +47 for the day which is by far and away my best day.
Its strange how things affect your trading, I tend to start a book with say £100 then when I get to £1000 I take it out and start again with £100 etc etc, I am always much more succesful when I have around £100-£500 in the pot, I just seem to be more careful and also becuase I use a smaller stake I tend to be much better at letting profits run and am also prepared to use bigger stops, when I up the stake ( I do this when I get above £500) I tend to get a bit more nervous and snatch profits and am inclined to use tighter stops, wierd how I know what I am doing wrong, but B**ger me its difficult to stop doing it!
Its strange how things affect your trading, I tend to start a book with say £100 then when I get to £1000 I take it out and start again with £100 etc etc, I am always much more succesful when I have around £100-£500 in the pot, I just seem to be more careful and also becuase I use a smaller stake I tend to be much better at letting profits run and am also prepared to use bigger stops, when I up the stake ( I do this when I get above £500) I tend to get a bit more nervous and snatch profits and am inclined to use tighter stops, wierd how I know what I am doing wrong, but B**ger me its difficult to stop doing it!
Outa my gourd
Member
- Messages
- 98
- Likes
- 1
wierd how I know what I am doing wrong, but B**ger me its difficult to stop doing it!
Don't knock it - something's obviously working for you 😆. Well done on today's catch 👍
Dentalfloss
Legendary member
- Messages
- 63,404
- Likes
- 3,726
Outa my gourd
Member
- Messages
- 98
- Likes
- 1
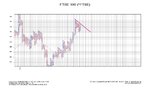
a classic example of how treacherous triangles can be.price gets coiled and broke downwards.it then recoils back into the triangle and out the other direction.
daily data
Perfect timing, Dentist. I'm just reading about P&F. Although I don't pretend that any of it is sinking in at the moment. Is this a 1 x 3? :smart:
Dentalfloss
Legendary member
- Messages
- 63,404
- Likes
- 3,726
Dentalfloss
Legendary member
- Messages
- 63,404
- Likes
- 3,726
SuddenDeath
Legendary member
- Messages
- 14,063
- Likes
- 143
good morning everyone
good morning people... caramilla h2 resistance 4503?
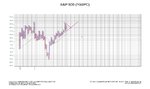
hi dentist.. re your P&F chart.. i am also reading a little on this.. would i be right in thinking that a tightening range is the sign of a oncoming breakout triangle formation? if so what clues on the P&F chart would you look for to ascertain the probable direction of the breakout.. or would you look eslewhere to find the answer/confirmtaion?
thanks gl
Last edited:
- Status
- Not open for further replies.
Similar threads
- Replies
- 72
- Views
- 19K
- Replies
- 21
- Views
- 7K