francisfinley
Established member
- Messages
- 902
- Likes
- 46
Good weekend everyone
just got back from cricket
we beat Bowdon after bowling them all out for 125 ...but my thumb is really sore after a drop catch in slip!! Ouch..........
Anyway back to my weekend Analysis
as always i highly recommend watching Inthemoneystocks videos
http://www.youtube.com/user/inthemoneystocks?gl=GB&hl=en-GB
Nasdaq analysis
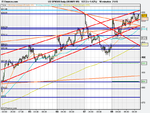
2 yr chart ................ neck-tie of 200 & 20 MA will be solid support @ 1370, if broken then next level 1300's.............If held then 1460 above here we come!!
1 yr chart - uptrend seams to have run out of steam .......red trend line indicating it, next level 1370!!
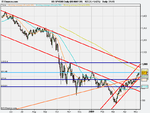
3 month, 4 hrs - this time frame also confirms the break out on the downside to 50 MA which coincides with 1370 again(interesting) , Nasdaq leads the S&P so I would also make the assertion that 930 is the high for S&P and we are heading southwards for now??
1 month , 1 hr - bearish again - red trendline channel depicts breakout on the down side , target of 1360 , 200 MA .......
1 week , 10 min - red trend line apparent ........beautiful short opportunities on every occasion
conclusion = short market .............downward targets of 1570 initially, if broken then 1360 - 1350 - 1340 !!
the leader is failing............So its followers shall also show signs of weakness
lets move onto the S&P
im watching the nasdaq with interest too.