Mathemagician made the following great post on TSW forum:
From the VantagePoint website (
http://www.markettechnologies.com/disclaimer.asp)...
quote:
--------------------------------------------------------------------------------
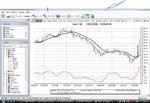
THE NEURAL INDEX PREDICTS WHETHER THE AVERAGE OF TOMORROW'S CLOSE AND THE CLOSE OF THE DAY AFTER TOMORROW (BOTH UNKNOWNS AT THIS TIME) WILL BE HIGHER OR LOWER THAN THE AVERAGE OF YESTERDAY'S CLOSE AND THE CLOSE OF THE DAY BEFORE YESTERDAY.
--------------------------------------------------------------------------------
It turns out that just checking to see if today's close is above the average price of the last two days makes this same prediction but with slightly higher accuracy than they claim.
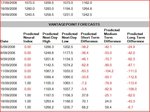
you can perform the same prediction statistically using the following TradeStation easylanguage code:
var: Threshold(0), Guess(0), Success(0), Failure(0);
Threshold=(c[1]+c[2])*0.5;
if c>Threshold then Guess=1;
if c<Threshold then Guess=-1;
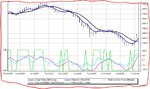
if Guess=1 then SetPlotColor(1,Blue);
if Guess=-1 then SetPlotColor(1,Red);
plot1(Threshold, "Threshold");
if (c+c[1])*0.5 > Threshold[2] and Guess[2]=1 then Success = Success + 1;
if (c+c[1])*0.5 < Threshold[2] and Guess[2]=1 then Failure = Failure + 1;
if (c+c[1])*0.5 < Threshold[2] and Guess[2]=-1 then Success = Success + 1;
if (c+c[1])*0.5 > Threshold[2] and Guess[2]=-1 then Failure = Failure + 1;
if LastBarOnChart and Success+Failure>0 then Print(GetSymbolName," ", NumToStr(Success,0)," ", NumToStr(Failure,0)," ", 100*Success/(Success+Failure));
While it is in fact accurate, this information is quite useless.