Trading with point and figure

Morning all.

Thanks for the help and views to Dentist, all being absorbed in my grey matter.
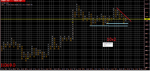
 
update on our dax chart

14uhl55.gif
 
Todays pivots are

R2 11197
R1 11127
PP 11081
S1 11012
S2 10966

Hopefully they wont change today!
 
testing trend res at 11115 to 11130 area...that was a minor pivot we marked yesterday in 11117
horizontal supp from yesterday 11060 area
trend supp/aqua and breakout point is 10980 area
a mass 0f trend and horizontal supp underneath that
 
updated spx

2lw3bxk.gif


spx since Monday morning
bears have only had 2 tradeable moves/red trendlines...lol
some other areas marked
 
11024-11050 should be a reasonably strong supp..lets see


11072-11104 should be res area
these are only guides
take the signals
 
Morning all.

Dentist when you say wait for the signal, what do you mean?

For me, I tend to identify an area of potential support / res. Go to my 1 min and if it holds / there is a strong reaction off it - then i take my position. At least that works for me.

What would you classify as a signal? Moneylender as well? Just be interesting to hear people's thoughts
 
On PnF charts the change over from"x" to "o"'s and viz a versa depending if the trend is up or down.
If there is no change of x and o ie a break out then the trend continues in origianal direction.

All to be confirmed by The Master!!!:smart::smart:

I am still learning!
 
To add, I don't trade with Pnf (i use candlesticks) so maybe the signals are different as Moneylenders says..
 
You can see the levels of interest here in blue with trend in red. Just looking for reversals and breakouts.
 

Attachments

  • 9.20.png
    9.20.png
    30 KB · Views: 81
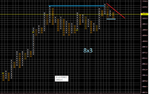
Tell us more Moneylender - why was it "expected"?

It went up and through thick blue line then retraced back through it (arrowed)
then i waited for the down signal on PnF, once that was in it was expected to fall

QED
 

Attachments

  • 4.50.png
    4.50.png
    20.4 KB · Views: 94
Top