Dentalfloss
Legendary member
- Messages
- 63,404
- Likes
- 3,726
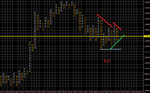
bears could get a lookin....no guarantees..lol

they have to break this 65/70 level first!!

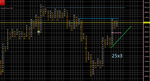
still holding..slightly lowerthey have to break this 65/70 level first!!
tightened stop on a small long from 60 area