Moneylender
Legendary member
- Messages
- 5,693
- Likes
- 369
nailed 11120 and 2092 areas
Top of the class, can we go down from here?:clap::clap:
nailed 11120 and 2092 areas
not sure..think there will be alot of messing firstTop of the class, can we go down from here?:clap::clap:
from that chart
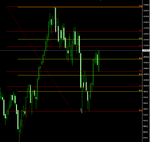
last count...one bosxhorizontal gives 2090-2092 as the target...that Could be res
that mauve cluster area could be a real magnet on pullback
11130 area working very nicely
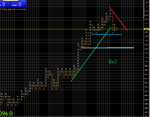
remember..this was only a guide
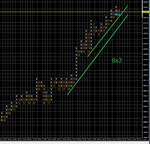
if you trade off levels..you might only get 3-5 trades a day
if you trade disequilibrium.ie breakouts..there should be at least 15-20 trades a day/per instrument.....more if you scalp
2092 area working well

back in our 11130 area..lets see what happens