You are using an out of date browser. It may not display this or other websites correctly.
You should upgrade or use an alternative browser.
You should upgrade or use an alternative browser.
Trading the US the Naz/Mr. Charts Way
- Thread starter Mr. Charts
- Start date
- Watchers 59
- Status
- Not open for further replies.
The Beyonder
Active member
- Messages
- 123
- Likes
- 5
you can't short it with IB either. Typical, as I was watching it as well.
rdstagg said:...is it right that direct access elite (or an other) can route the order simply by clicking on the relevant quote in L2? Or is there a simple way I can do this in TS8?
For anyone interested...
On TS8.
On the Level 2 screen Right Click > Format Window > 'General' Tab
At the bottom of the General tab, you can choose what single click and double click do (two seperate choices).
You have a choice of "Fill Order Bar With Price, Quantity, Route" (Or any combination of these three).
You can also have a single or double click to "Track ID", which highlights the ID you are on. I usually track the Ax.
Mr. Charts
Legendary member
- Messages
- 7,370
- Likes
- 1,200
Four trades today:
BIIB -10c
ERTS +24c
INTU -6c
AAPL +$2.65
The AAPL one was the most interesting.
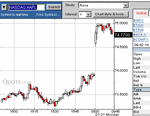
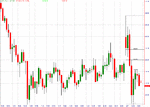
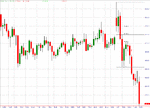
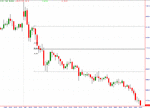
Price gapped up and ran to $75, had a few attempts to breach it, failed,came back to the Fibonacci 50% retracement at 74.77 (good stuff Naz !). Looking at the chart all you can see is the price falling....... However charts are not the whole story and my micro analysis of the detailed price action showed buying support building at this level so I went long as shown on the first chart. A pure chartist would be horrified at going long there ;-) I do think you have to see the whole picture, not just one piece in the mosaic.
It was very unlikely that support at that level was going to fail and it didn't. Had it done so I would have been out for a loss of, at worst, a few cents as on today's two losing trades.
That was my risk. The reward was unpredictable so the R/R could not be guessed at.
Again the actual probability of failure was low and the probability of success high - factors most people do not even consider when they think about R/R - they tend to believe it's 50/50......
I did not run this trade as a quick scalp type move because I could see from the micro analysis of trades printing off, buy and sell pressures, and the behaviour of the market participants that there was probably more momentum left.
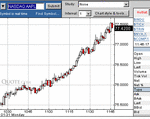
Two hours later it reached $77.56 then the balance of probabilities changed and was no longer one sided as the factors which made me go long at the Fib level reversed and as it slipped to $77.42 I exited for a profit of $2.65.
Less than an hour later it had another attempt to push north and was again met with resistance and failed at the same level.
Currently it is in a range which might offer another decent opportunity if it breaks up or breaks down out of that range.
I hope someone finds the above useful.
Richard
Attachments
compoundup
Junior member
- Messages
- 25
- Likes
- 1
I missed an entry point early doors on AAPL and then decided not to chase it - ah well, there'll be another one along I thought - but never found it.
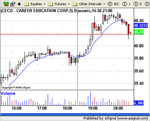
CECO gave me a long run at the extreme of the day just under 40.50 which eventually failed and cost me 6 cents.
I did manage +13c on a SNDK short just to reassure myself that it wasn't my interpretation that was failing
CECO gave me a long run at the extreme of the day just under 40.50 which eventually failed and cost me 6 cents.
I did manage +13c on a SNDK short just to reassure myself that it wasn't my interpretation that was failing
Attachments
Salty Gibbon
Experienced member
- Messages
- 1,535
- Likes
- 6
Great trade on AAPL Richard - makes me slightly green with envy.
I was looking at the results on your other three trades though and just wondering if you were experiencing a slightly difficult day ( AAPL apart of course ). Those 3 trades netted just 8 points.
The reason I ask is that I found trading on Monday quite difficult and all of my trades were very slow and "scratchy" and I ended up a net small negative for the day.
Was it me or was it generally a teeny weeny bitch of a day ?
Mr. Charts
Legendary member
- Messages
- 7,370
- Likes
- 1,200
Hi Salty,
Yep, what our cousins call a "gap and crap day".
They are the days when many traders break even or only make small profits or small losses................unless you can find the winners like AAPL.
I was on to it for two reasons,
a) News pre-market just as rdstagg mentioned
b) Apple is one of my core (sorry!) trading stocks
Richard
Mr. Charts
Legendary member
- Messages
- 7,370
- Likes
- 1,200
Looks like we might have some nice moves on our old friends the triad of SOHU SINA NTES today, esp SOHU
Richard
Richard
Naz
Experienced member
- Messages
- 1,391
- Likes
- 25
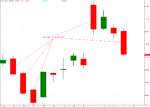
I closed out most of the position as it fell to $200,that big psychological level.I reckon its a big red candle day,so i've got a very small part left that i'll close out near the close.Yes i wish i'd held the lot but i didnt.
I would have written more but i was to busy trading.
Naz
I would have written more but i was to busy trading.
Naz
Naz
Experienced member
- Messages
- 1,391
- Likes
- 25
Naz
Experienced member
- Messages
- 1,391
- Likes
- 25
Yesterday i traded two extra markets favoured by two trading friends of mine which i sometimes look at.As i'm going out with them tonight i thought it would add to the banter we have when discussing various trading topics we agree/disagree on.
I started at 9am and by 11am i'd nearly gone to sleep.Nothing seems to move,(thats movement by my standards),everyone it seems is waiting for the US markets.By the time the US markets opened i was in a bored state and frankly fed up,it was like watching paint dry.
Then a light was switched on and my world suddenly became alive,yep the Nasdaq had sprang to life and normal service was resumed.
When i see them tonight i've got plenty of amunition for our banter. 😎
Last edited:
Mr. Charts
Legendary member
- Messages
- 7,370
- Likes
- 1,200
ISON looking good
- Status
- Not open for further replies.
Similar threads
- Replies
- 254
- Views
- 44K
- Replies
- 6
- Views
- 4K
- Replies
- 134
- Views
- 30K
- Replies
- 18
- Views
- 5K

