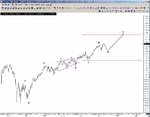
Trading the SPX

Joules MM1 said:
Hi Atilla, you're making that wall of worry look freshly painted today.........btw, in 1942 the dow went on a 5 month buying binge.......in the middle of WWII..........

Thanks Joules and BTD...

Just carrying out a pulse check incase it was only my blood pressure that was up... :LOL:

Didn't know about that buying binge in middle of war. Interesting... Is this what they call stuff legends are made of...? :rolleyes:

Regards,
 
About Ganns cycles application in context of Elliott..........

I am not a Gannite, Gannist or Gann-person the same way I am no longer an Elliottician.........although I do have extensive knoweldge from very exhaustive study of Elliott...........

with that and with respect please allow me to point out one specific reason for draw-downs from the inappropriate employ of cycles over Elliotts wave structures..........

Elliotts structures are based in fractals of nature and are specific to design so while a top can be found using Gann or a plethora of other techniques they do not and cannot be specific to Elliott because they are not locked or phased to Elliotts structures..........a minor or primary top may coincide with a typical time period of 100 to 61.8 for Fibonacci or 100 to 70 for geometrics or (as supplied by BTD) 100 to 62.5 and so on..........these are more often cyclic on a fifty/fifty basis ..........in other words the ratio does not carry the same implications pf the actual trend only that you'll SOME KIND of time coincidence, some size of correlation, yet, rarely will/does that correlation provide symmetry of price and time that we'd like........not like painting by numbers because, of course if that were true that the cycles worked together then we' could just put the jigsaw together and bingo...........While its true that we are likely to encounter sizes of primary degree of above we don't know until the next period (the extension of 100%) has concluded........this says that we had to wait the whole period to get that clue...........and that's all we are getting.........a clue that SOMETHING MIGHT happen...................my point is, yes, we are discussing probabilities.............but we don't know the RELATIVE CONTEXT of that probability when it arrives and we are then basing judgement from within the wave structure which is not (empirically) related......least we don't know that (yet) so all the while we are waiting for the patterns to unfurl..........we can't trade history...........we can attempt to extrapolate from the past into the future but on the larger degree scale and then, again, we must await confirmations..........meanwhile, history is passing our trades by...........then........the big challenge...........while we can employ these combinations of cycle and Elliott we do so by not then knowing if the smaller cycles and the lower degrees of trend are correct within the larger degrees as governed by the forecast that we are leaning on.........so this then calls for us to look for support and resistances and volume analysis.............like a taking a big step into another area to get confirmation of our cycle and Elliott forecasts ( that is, to get confirmations tha the larger degree forecast has validity) .............you see where I'm going with this..........this is merely my opinion...............something to think on..............
 
Atilla said:
Thanks Joules and BTD...

Just carrying out a pulse check incase it was only my blood pressure that was up... :LOL:

Didn't know about that buying binge in middle of war. Interesting... Is this what they call stuff legends are made of...? :rolleyes:

Regards,

Atilla, the point was to show context.............yes the subprime market implosion has some trickle down effect.......that's within the realm of the the large houses (institutions, mutuals etc) but how does that effect TODAYS lowest degree trend action? how can this be placed into relative context...........also, the emotional extremes do not play out at all levels of capital and opportunities for a a buy into a bull market exist in the same extremes as opportunities to sell into a bear market..............just depends on your perspective..............and yeah, size means everyting in the jungle..........but you still gotta know what/when to do with it............
 
OOOOOOOOOOOH AAAAAAAAAAAAH

Friday 13th

( I think it might commemorate the massacre of St. Bartholomew's Day )

Got a small long at the mo which may change should the market show weakness
 
Pat494 said:
And bailed out for a small loss !!

I've shorted SPX from yesterday @1446.4. Expecting a fall but not sure about it's magnitude.

Waiting for stats now...
 
Atilla said:
I've shorted SPX from yesterday @1446.4. Expecting a fall but not sure about it's magnitude.

Waiting for stats now...

Got out at 1450.6 :eek:

Wondering which way it's going to go now.

May move in on sudden big surges if it's down will stay away if it rises...
 
Bez said:
31st of March
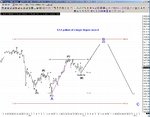
To expand on why I favour the A-B-C....
That last low move down on friday from the 1329 (1429) level was the 4th low & we know what that means under delta rules..
I'm still leaning on this 3,3,5 flat count as it would fit the delta very nicely....just need Iran to behave itself to 13th- 17th window of April when the Higher frames are normally due :eek:

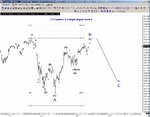
Little update of that 31st of March chart, now I've had after a nice easter break in the sun :eek:.....as we now coming into that 13th-16th time window.
 

Attachments

  • favcount.jpg
    favcount.jpg
    218.9 KB · Views: 204
  • bull count2.jpg
    bull count2.jpg
    227.6 KB · Views: 185
Buy The Dips said:
From Steve Copans site ITD 4 - MTD 9 completing in here.....
I've seen solutions where ML-TD #3 could extend into late April.......if so.......things may continue down into that late April confluence of ITD 7 MTD 10 ML-TD 3

Yes we due the MTD point 9 around this area that one of the reasons I posted that chart back on the 31st of March..It still makes me smile still simle how SC has numbered the Intermediates for the general public consuption :))))

I would lean on the 14th of March being the seasonal long point 3 (MT-TD) due to the MTD point 8 coming slighlty early....

:)
 
Bez said:
Yes we due the MTD point 9 around this area that one of the reasons I posted that chart back on the 31st of March..It still makes me smile still simle how SC has numbered the Intermediates for the general public consuption :))))

I would lean on the 14th of March being the seasonal long point 3 (MT-TD) due to the MTD point 8 coming slighlty early....

:)

Sorry to be so thick but In plain English is that an up or down for those of us that don't really understand what you are saying ? ( no offence naturally)
 
Last edited:
Hi pat :)

Basicly Were due some downward pressure over the next few days as the Intermedate Delta time frame is due.
The question is... This time window is the earliest window the next higher frame of delta, (the medium) can come in. We need the higher frame to come in get the big moves everyone likes, but I need to take a closer look at the lower time frames to see if the odds favour the Medium Frame coming in with this time window or the next one...:)
 
Bez said:
Hi pat :)

Basicly Were due some downward pressure over the next few days as the Intermedate Delta time frame is due.
The question is... This time window is the earliest window the next higher frame of delta, (the medium) can come in. We need the higher frame to come in get the big moves everyone likes, but I need to take a closer look at the lower time frames to see if the odds favour the Medium Frame coming in with this time window or the next one...:)

Thx Bez
I guess that's a maybe.
Checking out Finspreads - their daily future price is 9 points above that quoted on Bloomberg !!
That seems a lot or are they expecting a rise in the near future ?
 
Buy The Dips said:
Yep, they do look suspicious :)

Well I've got the jitters but decided to go short again at 1447.8. Going to stick with it now unless it goes rocketing past 1453 regions...

Pat - The Delta Book is well worth a read and has made sense of your excellent posts on these threads. I'm not sure about applying it my self yet but worth the money spent. Waiting for a quiet period to read it again...

You can buy it from Trader Tom's site which is the cheapest I've seen for about £50...
 
update of last post

Joules MM1 said:
hey BTD ...........champion, thanks for the reply

still liking the long plays.......


sideways day..........made a good support for inter market action........ftse longs best earner and the spx made very good precash lift and sell............a little 'hook or by crook' conduct......the usual suspects..........
 

Attachments

  • spx updated 130407.gif
    spx updated 130407.gif
    21 KB · Views: 228
Todays an orange day which means its cycle day 1 on the Short Term Cycle...

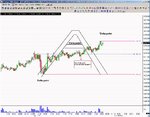
As I've mentioned before you often get an A shaped intraday chart pattern with the 3 points of the A representing the delta points...Low High Low with the high coming in the 1-2pm (est) lunch window...


A chart always helps :)

ES 5min.....

Edit: I should of mentioned the possable inverson point as this is cycle day 1...:eek:
Least its a very useful example of a point 1 Inversion and how to use the A pattern...
 

Attachments

  • orange days.jpg
    orange days.jpg
    189.4 KB · Views: 233
  • inverson.jpg
    inverson.jpg
    201.3 KB · Views: 197
Last edited:
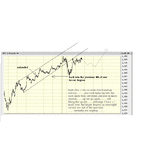
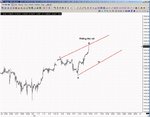
The Spx could be awkward & morph it to one of those pesky Ending Diagonal patterns of this lesser c to complete the (B)
:?:

Thanks Joules for the feed back :!: :)
Although your EW is far better than mine :eek:
 

Attachments

  • akward2jpg.jpg
    akward2jpg.jpg
    202.4 KB · Views: 238
Last edited:
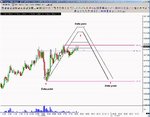
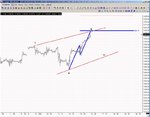
This is an interesting Globex Set up...

MOB the 1469.75 on the ES Futs

Delta has a high first hour high out of interest...

Edit Its "riding the rail" as it called this is the last chance saloon for that ED count....& I've re-sized the images so they'll load abit quicker....
 

Attachments

  • setup1jpg.jpg
    setup1jpg.jpg
    71.4 KB · Views: 180
  • railjpg.jpg
    railjpg.jpg
    70.2 KB · Views: 208
Last edited:
Bez said:
This is an interesting Globex Set up...

MOB the 1469.75 on the ES Futs

Delta has a high before 10am out of interest...

Edit Its "riding the rail" as it called this is the last chance saloon for that ED count....& I've re-sized the images so they'll load abit quicker....

Based on my BBs and MAs just about every chart, weekly, daily and hourly are indicating long positions... I'm going to sit out and watch the rise. Reluctant to go long as I have no faith in the fundamentals and don't like it when they diverge in such dramatic fashion... :rolleyes:
 
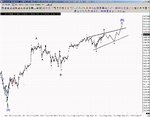
I though some bigger picture EW charts might help :?:

This is a weekly SPX chart that fits the longer term delta...
 

Attachments

  • bigpic.jpg
    bigpic.jpg
    195.6 KB · Views: 212
Top