Racer
Senior member
- Messages
- 2,666
- Likes
- 30
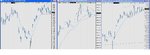
Joules MM1 said:Try drawing the channel from the second (lower) high in the DJIND through to this month.
I fing effective channels start from the second (wave) extreme which is usually the confirming high or low of the next larger trend movement.
Normally I don't like drawing lines from too far away with a big gap in the middle because you can always fit them to suit if you want really!
Last edited: