05-oct-15 - crude oil
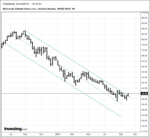
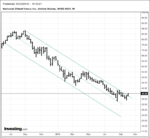
Oil price has been falling for over a year. First weekly chart shows price hitting lows of 2009. Second weekly is just zoomed in on the last year or so. There appears to be a wedge forming but on smaller timeframes it looks more like a range so I haven't drawn it on.
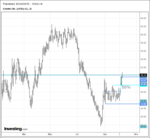
On the daily price has been in a range since the end of august. This range was traded twice before this year. As per blue box.
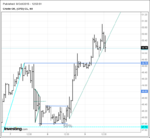
The hourly shows price behaviour around the support/resistance and mean of the range. I see a lot of spikes in the price throughout the range. I assume this is because of news reports on the plethora of political and commercial variables that have an effect on the price of oil.


