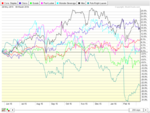
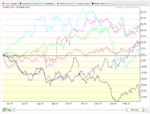
A lot of lines there. Harder to see swings. I will try to next time to use stockcharts.com. Thanks!I suggest you use Stockcharts.com. They do all this for you and the charts are closer to the proper aspect ratio. The more squashed your charts are, the more difficult it will be to see the swings.
Db
You are using an out of date browser. It may not display this or other websites correctly.
You should upgrade or use an alternative browser.
You should upgrade or use an alternative browser.
Xlf
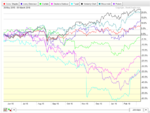
Financial sector. The weakest stocks.
Some of the stocks were deleted due to my Buying power and Daily Average true range.
Financial sector. The weakest stocks.
Some of the stocks were deleted due to my Buying power and Daily Average true range.
Attachments
Xlv
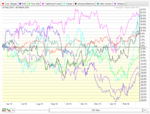
Healthcare sector. The weakest stocks.
Healthcare sector. The weakest stocks.
Attachments
-
 abc.png75.5 KB · Views: 182
 -
 alxn.png75.6 KB · Views: 185
 -
 celg.png74.2 KB · Views: 176
 -
 cern.png75.7 KB · Views: 179
 -
 endp.png73.8 KB · Views: 182
 -
 vrtx.png72.9 KB · Views: 169
 -
 mck.png77.9 KB · Views: 207
 -
 lly.png86.8 KB · Views: 213
 -
 gild.png72.7 KB · Views: 178
 -
 esrx.png76.3 KB · Views: 173
 -
 zts.png74.2 KB · Views: 183
dbphoenix
Guest Author
- Messages
- 6,954
- Likes
- 1,266
A lot of lines there. Harder to see swings. I will try to next time to use stockcharts.com. Thanks!
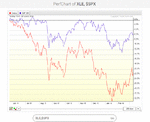
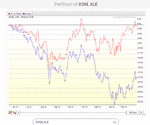
Go to this page.
Scroll down to Perf Charts. Under Create A Perf Chart, enter, for example, XLE and $SPX or XOM and XLE.
As long as you're going to do all this work, you may as well generate charts that are clear and informative.
Attachments
dbphoenix
Guest Author
- Messages
- 6,954
- Likes
- 1,266
Financial sector. The weakest stocks.
Some of the stocks were deleted due to my Buying power and Daily Average true range.
If you're doing this for the practice, fine. If you're looking for trading vehicles, weak stocks are not the better choice. Weak stocks are for bottom-fishers (see the Appendix to the Burrow). They may take months to go anywhere. For short-term trading, much less daytrading, you'll want momentum stocks. Those will be found in the strongest sectors, such as Consumer Non-Durables.
Db
dbphoenix
Guest Author
- Messages
- 6,954
- Likes
- 1,266
I have chosen Utilities and Consumer Staples sectors as the strongest.
Consumer Staples and Consumer Non-Durables are the same thing: XLP.
Go to this page.
Scroll down to Perf Charts. Under Create A Perf Chart, enter, for example, XLE and $SPX or XOM and XLE.
As long as you're going to do all this work, you may as well generate charts that are clear and informative.
Oh, thats much better. Thank you! For sure will use it!
If you're doing this for the practice, fine. If you're looking for trading vehicles, weak stocks are not the better choice. Weak stocks are for bottom-fishers (see the Appendix to the Burrow). They may take months to go anywhere. For short-term trading, much less daytrading, you'll want momentum stocks. Those will be found in the strongest sectors, such as Consumer Non-Durables.
Db
Yes, I am looking for active stocks, to trade intraday. Do you disapprove daytrading?
If we can use the same principles with smaller waves, why not to trade? Not just trade something, but using situations or places where money from a higher Time Frame can be interested in a move.
Bottom Fishing. Market can change its direction and can go lower. If the weakest stocks are for bottom fishing, then what stocks we should choose to trade on the short side?
Thank you!
Similar threads
- Replies
- 96
- Views
- 20K
- Replies
- 80
- Views
- 26K


