Trading from Charts

I have to be honest and say: whilst my point 3) IS correct: S&R lines “can be found in randomly generated data” and whilst, as I demonstrated, randomly drawn lines can act as S&R lines’, I actually agree with cuddykid and you that double/triple top/bottom ‘patterns’ (ouch that hurt!) have significance. And, perhaps for the reason you give, which if true would mean that the other popular ‘patterns’ such as Fibonacci have equal validity. Does this mean I would buy an ‘Expert Advisor’ based on these criteria? No, absolutely not, which means one of two things 1) using an EA as a test of whether an event has greater than 50% predictability is not valid, which I don’t believe for a moment, or 2) whether the price bounces or goes through is 50/50 unless other judgement comes into play.

So jimioddy are you saying that double/triple top/bottom patterns are the only areas you would validate as key S/R levels.
 
I hope he does as it was a good reply and would like to see more of that.Yes or no would of done.
 
I hope he does as it was a good reply and would like to see more of that.Yes or no would of done.

- - - - - -

What I have just proved is that an argument about patterns and lines is equally convincing when the lines are drawn randomly. I accept that it does not follow therefore that the massive industry that is ‘Forex Education’ is wrong about everything. It might be, but the good news is they make a lot of money out of it (yours).

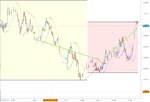
Yesterday I took your example of USDCHF and made a prediction which turned out to be right, exactly right! (As I expected). I predicted a price of 0.924. What happened? The price found support from my dotted green trend line, unhesitatingly burst through my dotted blue trend line, reached my predicted horizontal line and tested it once, twice and three times before dropping. Remember all my lines are random, or at least drawn with my eyes closed (no peeking) if someone wants to challenge my use of the word random.

As I write this reply the price is fast dropping to the 'confluence' (see later) of three of my lines and I expect to make more money using this mumbo-jumbo nonsense. I hope you do too.

I am not saying that ‘double/triple top/bottom patterns are the only areas I would validate as key S/R levels’.

No, I reject it all. All of it. How many random lines do I have to draw (and I've drawn hundreds (maybe not thousands though)) to convince myself that the beautiful explanations of the experts are all entertaining nonsense? Remember my perspective, it is me, I am not attacking anyone. If people make money using those explanations, then good. I am pleased for them. But the only way they'll convince me is to tell me what is going to happen before it does - and it happens as predicted more than 50% of the time.

Yes, I make money looking at charts, but I’m still trying to shake off these superstitions. Like one heretic claiming that the earth is not the centre of the universe I am under attack from those whose power and profit rely on no-one questioning their view.

Why are my lines on the USDCHF chart nonsense? Brilliant as they are! If there is a statistician out there who’s got the necessary understanding, or if anyone knows of one, then he/she will explain that it’s all in the margin of error. I would love to read his/her thesis.

Think about what a candle stick is, really is or really represents (language is a powerful analytical tool) and you begin to see the source of self-deception. Having said that about language, it is not an invitation to the diminutive nit-pickers to disassemble my rantings and pick up on one of my words such as ‘fact’. Yes, my use of the word 'confluence' above was imprecise, but not totally off target. Plllleeeeease.

If anyone has anything constructive to say I would really, really like to hear it. If not, I must be on the wrong forum.

I don’t want to disabuse anyone of their illusions, I simply seek a rational basis for my trading.
 

Attachments

  • USDCHF3.JPG
    USDCHF3.JPG
    144.8 KB · Views: 132
brettus - Please explain.

Candlestick patterns.

Pinbars - Rejections of levels, reversals same as bullish engulfing and bearish engulfing. Stronger the bounce off support, stronger the buyers.

Doji's - Indecision.

Daily ATR getting lower and lower over time. Consolidation. Low volatility. Indecision. Chance of potential strong breakout increasing over time. Look at USDJPY for example. Since October 2010 - March 2011 it has been stuck between a 5 big figure range and this range has been getting smaller over time, like a tightly wound coil ready to snap and it did, this pattern should have brought fear and greed.

Even looking at a chart and seeing a 400 point move in a day should bring about these emotions. You can see the volatility in the market from a chart, you can also see the potential volatility from over consolidation.

Patterns, you may find with gbpusd that at the majority of levels, it double touches before reverting, but with usdjpy it always one touches. AUDUSD always has small breakouts of 5-10 ticks. I don't really look at head and shoulders, but when a currency pair does finally break through many higher lows/lower highs and the trend looks like its changing, theres usually a bounce at some point that meets resistence or support.
 
Nice eloquent language.
What is your specific prediction?
Please publish your chart like I did.
What's the problem?
How better to prove your point?
No offense.
Let's check it out.
 
- - - - - -

What I have just proved is that an argument about patterns and lines is equally convincing when the lines are drawn randomly. I accept that it does not follow therefore that the massive industry that is ‘Forex Education’ is wrong about everything. It might be, but the good news is they make a lot of money out of it (yours).

... snip ...

If anyone has anything constructive to say I would really, really like to hear it. If not, I must be on the wrong forum.

I don’t want to disabuse anyone of their illusions, I simply seek a rational basis for my trading.

There seems no doubt that the best traders need little besides the price action.

Others find MA, Fibs and Pivots useful.

A number of us have been impressed by the accuracy of FMRL reversal levels on FF.
 
I said earlier in this thread that I find this subject endlessly fascinating. I’ve rubbished chart techniques, but by the name of this thread you can see that I trade using charts and I’m happy living with this apparent contradiction.

One of the subjects that interests me is the ‘shape’ of ‘traced’ prices, which I tried to explain earlier. In addition I compare morning shapes to afternoon shapes, which (depending on the shape, timescale, instrument etc etc etc) shows a bias of 2 to 1. Good odds for me.

MAny of us use the phrase ‘Price Action’ but have different understandings. For me ‘Price Action’ is exactly as described by Al Brooks in his interesting but difficult book ‘Reading Price Charts Bar by Bar’ in which he says: “I freely recognise that every one of my reasons behind each set up is just my opinion and my reasoning about why a trade works might be completely wrong”. This guy has complete credibility with me whether or not I apply his insights.

I cannot agree wholeheartedly with your assertion “There seems no doubt that the best traders need little besides the price action”. Maybe they do, maybe they don’t. Is it folklore or demonstrable fact?

“A number of us have been impressed by the accuracy of FMRL reversal levels on FF”.

Are they better than random lines?

I’m making money right now trading the GBPUSD using nothing more than a random entry and trendline exit. Is the price going to continue or reverse? We'll see.

Remeber, even accurate prediction is only evidence, not proof.

And I’ve already referred to the “Well it works for me” comment.
Great! But useless as far as I'm concerned unless it works for me too!
 
This is what I'm looking at.
Any comments or predictions?
 

Attachments

  • GBPUSD 1435 30Mar2011.JPG
    GBPUSD 1435 30Mar2011.JPG
    120.7 KB · Views: 182
This is purley for my own selfish fact finding,Enter a long position to test levels at round numbers.Support shown above 1.6000 see if price will retrace from 1.6100 or pause and break through.
 

Attachments

  • nakedhoundgbp.gif
    nakedhoundgbp.gif
    19.6 KB · Views: 153
daily has bounce well off the 1.5980 level today. I'd probably stay long above it and short below.


When I started trading two years ago I wanted to find a good strategy and then understand how it really worked. I failed.

Today's results are based on: get in, wait, get out.

I have parabolic SARs on this chart, but I don't look at them - they just make it pretty.
 

Attachments

  • GBPUSD 1600 30Mar2011.JPG
    GBPUSD 1600 30Mar2011.JPG
    81.8 KB · Views: 139
jimi

I've been sort of half following your thread but i'm not at all clear what point you're trying to make.

If your purpose is to show that TA is useless then the fact that price appears to have reacted occasionally to your irrationally (eyes shut) drawn lines demonstrates nothing. It is akin to the fallacious argument "This idiot has blue eyes, therefore all blue eyed people are idiots".

If your purpose is to show that your bottom line depends on where you get out rather than where you get in, then I'm with you rather more albeit that a well-timed entry helps enormously.

jon
 
When I started trading two years ago I wanted to find a good strategy and then understand how it really worked. I failed.

Today's results are based on: get in, wait, get out.

I have parabolic SARs on this chart, but I don't look at them - they just make it pretty.

Yea. it's bit of bs all this TA nonsense. I just look at levels..
 
jimi

I've been sort of half following your thread but i'm not at all clear what point you're trying to make.

If your purpose is to show that TA is useless then the fact that price appears to have reacted occasionally to your irrationally (eyes shut) drawn lines demonstrates nothing. It is akin to the fallacious argument "This idiot has blue eyes, therefore all blue eyed people are idiots".

If your purpose is to show that your bottom line depends on where you get out rather than where you get in, then I'm with you rather more albeit that a well-timed entry helps enormously.

jon

It's another T2W Godwin's law thread...
 
I'm not trying to make a point, my humble aim is to obtain the insight of others into the challenges I find most irksome. Maybe I will summarise a little later if people are not too bored.

I never, ever read my horoscope because (in my humble opinion i.e. I’m not being arrogant since it is mine and I force it on no-one, nor intend insulting other's beliefs) that would be stupid and futile even if it is absolutely correct!

This is because I prefer a rational explanation and the position of the planets or the shapes seen in price charts doesn’t do it for me. For sure, absolutely and with no doubt I can see that markets have repetitive behaviour, but there’s just so many patterns that can be arranged with a bunch of candles. If you’re talking technical indicators, then there is no limit!

I agree with your last point.
 
So far so good,finding it all interesting,and there's no real handbags flying so carry on.
 
Top