Stunning Charts Thread

personally, i wouldnt take the trade based on the information given. i would want to see the activity on previous days before making a directional call. without this information, it becomes more of a gamble than a trade as the underlying strategy of those in the know remains unknown. was that decline a new multi day low? or was it simply a correction from a very strong close last night? in this sense, it is a trick question and really shouldnt be asked to newbie traders as it will only encourage wrong assumptions to be made with too little information.

so, without this information, i would be as objective as possible as it could go either way. based upon the cluster of price bars afetr the short rally, i would buy on an upside break, and sell on a down side break. as soon as one side was filled, i would place a stop on the other side for three times the size in case the first move was a fake. the 2nd move (if the first was a fake) is far more likely to be real. one size to cover the losing position, 2 size to make back my loss, 3 size to come out with a profit.

of course, there could be 2 fakes, in which case im well and truly in the hole. never mind, there is always tomorrow. if one was uneasy with such a strategy, then the sensible strategy would be to exercise some self discipline and wait for the market to show its hand and perhaps get in on a correction. no one is putting a gun to your head and saying you must trade here. it is better to wait for sure trades than gamble in uncertain conditions.

of course, playing guess the direction is the work of an analyst, and i have no intention of everbecoming some paper pushing analyst. as a trader, i know the secret to profit is the correct management of a trade, and myself - not guessing which direction it could go.

happy days

:)
 
Last edited:
Thank you to everyone who posted positive contributions and to those who emailed and PM-ed me. I’ll reply to the personal messages asap but it will take me some time.
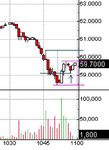
Look at what happened when price fell through $60 – there was a volume spike of buying, but the mood was still negative and that overcame that covering pressure.
Nevertheless, it did suggest that perhaps there were plenty of shorts concerned about getting squeezed and being ready to buy back on signs of buying pressure and/or the universe of shorters being exhausted.
Price then dropped to below the next whole number and then turned north on the strongest volume of the day. Why doesn’t matter, but almost certainly one or two market participants would have come in on the bid side to support the price. Probably everyone who had wanted to unload their holdings or who had shorted had actually done so. Who was left to sell? But you don’t know that at the time unless you see a lot of buying – which there was.At that point in time I was trading something else and wasn’t looking at HSIC. Had I been doing so I would have bought at 59 and change provided micro-analysis looked positive. By micro-analysis I mean buy and sell pressures from the main handlers of stock and on the ECNs as they placed their orders at prices and volumes plus time and sales to show actual trades printing off. This is a large subject and beyond the scope of these posts.
I looked at this stock a couple of minutes before I went LONG, the trade being at the time of that screen shot. Micro-analysis was NOT ESSENTIAL but confirmed the potential up move was about to take place.
So, what is the chart pattern?
Look at that long white candle and its volume. Clearly that is positive buying AND short covering. That doesn’t necessarily mean it will reverse, it might merely be a retracement. However, by entering on momentum, (or imminent momentum as visible on micro-analysis), you are highly likely to have that momentum carry you into decent profit – even if it is only a retracement – provided you read the sentiment and act accordingly if and when it turns against you. In other words, you gain profits even if you are proved wrong.
Now look at what happened AFTER the stock bottomed.
There was a low followed by a high at the top of the doji (third candle from the start of the up move). All three were on very respectable volume. There were then two down candles on lower volume which then formed a higher low.
What did we then have in place?
Low – high – higher low – three out of the four pre-requisites of a new trend.
It is very easy not to see new trends forming because most people, especially amateur traders, take a long time to change their minds about what is happening – so long they lose out time after time.
You must be able to turn on a dime and act accordingly regardless of your “opinion” when the facts change – otherwise you are guaranteed to fail at this business.
Now the last two candles are moving up, CONFIRMING the new trend as being highly probable as they are resuming a northerly direction. But hang on, some might say, the price is rising on poor volume so must be unreliable.
Many will disagree strongly with the following and can quote as many “experts” and books as they like, but I tell you I have been trading US stocks for a living full time since 1999 and I assure you price will frequently rise on low volume. Futures might be different.
Another very popular fallacy is that you must have a volume blow off for a reversal to be likely. Not so.
Look at how the actual volume came in on the reversal candle, NOT the final down candle.

Another common error when people look at contemporaneous charts, (as distinct from charts after the event), is to assume the latest candle, (in this case a one minute), is complete. Look at the time – it is 10.59.2? – in other words the current candle is only showing less than half the time frame of one minute).
A new trend forming after a recent bottom with some volume confirmation on the reversal IS the chart pattern I am talking about.
The intent is also helpful to know and by that I mean what I can see on micro-analysis and if that confirms market makers and/or ECNs showing definite buying intent.
This is often visible BEFORE anything shows on a volume bar or on a price chart…….
This gives you a great heads up as to what will probably happen next – not certainly, but with a high degree of probability – an additional winning edge.
I will post the chart of what actually happened later on. Reason – I think it is better to read the above comments first and relate them to the entry chart I posted yesterday.
It has taken me a very long time with my slow two finger typing to write all this down so I’d like to think at least a few people read the comments in conjunction with the entry chart.
Is it complicated – no – you SEE it happening – it takes hugely longer to write it down and for someone to understand it. However, if you put the effort in I hope you find it worthwhile.
It’s rather like anticipating the road ahead when you are driving, you can see what will probably occur a lot of the time, but try describing it in words at the time and it takes an age.

The price went up and into profit immediately.
Had the trade failed I would have exited either as soon as the momentum turned against me on micro-analysis or on a breach of the bottom of the existing entry candle.

Enough for now.
Exit chart later.
Unless anyone would care to say where price was likely to have reached……?
Richard
 
Thank you for taking the time to post your analysis, Richard.

This woolly amateur would be looking to scale out most of my position at 60.40 as it is a simple 1:1 (distance between pink lines = distance between dark blue lines), also an area of previous heavy selling as shown by the inverted hammer and finally a chance to sell comfortably before the half prime crowd at 60.50?

If this target was met I'd then move stop to b/e (expecting a pullback to the higher of the purple lines, the #2 breakout point) and leave a runner in with a target of just under 61 where there was a decisive breakdown of support.

One tick above the bar marked by the blue arrow is where I might have taken a 123 entry with a stop just below its low, for what it's worth. Given the suggested exit above the R/R would be approx 45 to 90 or 1:2 (not including the runner's potential) which is just about acceptable.
 

Attachments

  • untitled.JPG
    untitled.JPG
    30.5 KB · Views: 298
Mr. Charts said:
Thank you to everyone who posted positive contributions and to those who emailed and PM-ed me. I’ll reply to the personal messages asap but it will take me some time.
Look at what happened when price fell through $60 – there was a volume spike of buying, but the mood was still negative and that overcame that covering pressure.
Nevertheless, it did suggest that perhaps there were plenty of shorts concerned about getting squeezed and being ready to buy back on signs of buying pressure and/or the universe of shorters being exhausted.
Price then dropped to below the next whole number and then turned north on the strongest volume of the day. Why doesn’t matter, but almost certainly one or two market participants would have come in on the bid side to support the price. Probably everyone who had wanted to unload their holdings or who had shorted had actually done so. Who was left to sell? But you don’t know that at the time unless you see a lot of buying – which there was.At that point in time I was trading something else and wasn’t looking at HSIC. Had I been doing so I would have bought at 59 and change provided micro-analysis looked positive. By micro-analysis I mean buy and sell pressures from the main handlers of stock and on the ECNs as they placed their orders at prices and volumes plus time and sales to show actual trades printing off. This is a large subject and beyond the scope of these posts.
I looked at this stock a couple of minutes before I went LONG, the trade being at the time of that screen shot. Micro-analysis was NOT ESSENTIAL but confirmed the potential up move was about to take place.
So, what is the chart pattern?
Look at that long white candle and its volume. Clearly that is positive buying AND short covering. That doesn’t necessarily mean it will reverse, it might merely be a retracement. However, by entering on momentum, (or imminent momentum as visible on micro-analysis), you are highly likely to have that momentum carry you into decent profit – even if it is only a retracement – provided you read the sentiment and act accordingly if and when it turns against you. In other words, you gain profits even if you are proved wrong.
Now look at what happened AFTER the stock bottomed.
There was a low followed by a high at the top of the doji (third candle from the start of the up move). All three were on very respectable volume. There were then two down candles on lower volume which then formed a higher low.
What did we then have in place?
Low – high – higher low – three out of the four pre-requisites of a new trend.
It is very easy not to see new trends forming because most people, especially amateur traders, take a long time to change their minds about what is happening – so long they lose out time after time.
You must be able to turn on a dime and act accordingly regardless of your “opinion” when the facts change – otherwise you are guaranteed to fail at this business.
Now the last two candles are moving up, CONFIRMING the new trend as being highly probable as they are resuming a northerly direction. But hang on, some might say, the price is rising on poor volume so must be unreliable.
Many will disagree strongly with the following and can quote as many “experts” and books as they like, but I tell you I have been trading US stocks for a living full time since 1999 and I assure you price will frequently rise on low volume. Futures might be different.
Another very popular fallacy is that you must have a volume blow off for a reversal to be likely. Not so.
Look at how the actual volume came in on the reversal candle, NOT the final down candle.

Another common error when people look at contemporaneous charts, (as distinct from charts after the event), is to assume the latest candle, (in this case a one minute), is complete. Look at the time – it is 10.59.2? – in other words the current candle is only showing less than half the time frame of one minute).
A new trend forming after a recent bottom with some volume confirmation on the reversal IS the chart pattern I am talking about.
The intent is also helpful to know and by that I mean what I can see on micro-analysis and if that confirms market makers and/or ECNs showing definite buying intent.
This is often visible BEFORE anything shows on a volume bar or on a price chart…….
This gives you a great heads up as to what will probably happen next – not certainly, but with a high degree of probability – an additional winning edge.
I will post the chart of what actually happened later on. Reason – I think it is better to read the above comments first and relate them to the entry chart I posted yesterday.
It has taken me a very long time with my slow two finger typing to write all this down so I’d like to think at least a few people read the comments in conjunction with the entry chart.
Is it complicated – no – you SEE it happening – it takes hugely longer to write it down and for someone to understand it. However, if you put the effort in I hope you find it worthwhile.
It’s rather like anticipating the road ahead when you are driving, you can see what will probably occur a lot of the time, but try describing it in words at the time and it takes an age.

The price went up and into profit immediately.
Had the trade failed I would have exited either as soon as the momentum turned against me on micro-analysis or on a breach of the bottom of the existing entry candle.

Enough for now.
Exit chart later.
Unless anyone would care to say where price was likely to have reached……?
Richard
Yes, go on.....61.400 or higher depending upon momentum if the "window" holds.

And if momentum grips and really holds, much higher than that.
 
charliechan said:
personally, i wouldnt take the trade based on the information given. i would want to see the activity on previous days before making a directional call. without this information, it becomes more of a gamble than a trade as the underlying strategy of those in the know remains unknown. was that decline a new multi day low? or was it simply a correction from a very strong close last night? in this sense, it is a trick question and really shouldnt be asked to newbie traders as it will only encourage wrong assumptions to be made with too little information.

so, without this information, i would be as objective as possible as it could go either way. based upon the cluster of price bars afetr the short rally, i would buy on an upside break, and sell on a down side break. as soon as one side was filled, i would place a stop on the other side for three times the size in case the first move was a fake. the 2nd move (if the first was a fake) is far more likely to be real. one size to cover the losing position, 2 size to make back my loss, 3 size to come out with a profit.

of course, there could be 2 fakes, in which case im well and truly in the hole. never mind, there is always tomorrow. if one was uneasy with such a strategy, then the sensible strategy would be to exercise some self discipline and wait for the market to show its hand and perhaps get in on a correction. no one is putting a gun to your head and saying you must trade here. it is better to wait for sure trades than gamble in uncertain conditions.

of course, playing guess the direction is the work of an analyst, and i have no intention of everbecoming some paper pushing analyst. as a trader, i know the secret to profit is the correct management of a trade, and myself - not guessing which direction it could go.

happy days

:)
Hello Charlie, I agree that this one is a difficult one for newbies but I do not view it as a trick question for any reason. But I will concede it does require a level of dealing skill newbies do not have and in these two respects you are perfectly right.

The real problem with it is not the background. The real problem is whether the volumetric impulse combined with the response combined with the market conditon existing at the time are sufficient for a "lemon pip" effect.

We await the result with interest.

Kind Regards To You.;)
 
SOCRATES said:
Hello Charlie, I agree that this one is a difficult one for newbies but I do not view it as a trick question for any reason. But I will concede it does require a level of dealing skill newbies do not have and in these two respects you are perfectly right.

The real problem with it is not the background. The real problem is whether the volumetric impulse combined with the response combined with the market conditon existing at the time are sufficient for a "lemon pip" effect.

We await the result with interest.

Kind Regards To You.;)


hello socrates,

yes - perhaps 'trick' was the wrong word. i hope richard never took offense at that.

i think background however should be taken into consideration, although i do realise that this view contradicts my earlier points about not wanting to be an analyst (my actual standpoint for clarification is that although analysis is useful, i do not think it is worth the consideration most give it. analysis will only cater for around 10% of the success factor, maybe 15% if combined with a set up pattern - if they are used). this is because when we see the background, we can put the move into context. this in turn helps us plan the trade. is this to be a counter trend type scalp, or perhaps if we make it past the daily low or high, would it be worth trying to trail? from the information presented, there is no way of telling. this is why i would rather have the market take me on board when it has made its mind up, rather than trying to out guess the market. this is also why i have a plan to fall back on in case the market tries to sucker me on a fake move.

as a side note, i think we should be VERY careful when using t&s to base decisions on.

i used to rely upon e-signal for my t&s data. then i changed to looking at the t&s data from the x-trader platform. what a difference! i can honestly say that esignnal must have been on valium or something as the prints were no where near the reality that i see on x-trader. who knows, maybe there is also something far superior to x-trader also?? always make sure the t&s is coming from your clearing member, and that whoever is providing t&s data, make sure they dont publish it in bursts as i understand ib do for example. (Lord knows where/how esignal got their data from - perhaps they made it up! the difference WAS that bad!!)
 
charliechan,
No "trick"
No offense taken :)
Trading on that day in HSIC was below the previous day's low and there was no longer term support level around.
I would have mentioned any significant longer term levels in the original post.
I agree T&S should never be taken in isolation; it is another brick in the wall and is integral to the situation, but no brick is significant by itself.
Richard

BTW, charliechan, I have seen quite a few of your posts in the last few months and, fwiw, I can't remember disagreeing with much of what you've said - just the opposite.
R
 
Mr. Charts said:
It has taken me a very long time with my slow two finger typing to write all this down so I’d like to think at least a few people read the comments in conjunction with the entry chart.
I did just as Richard suggests and recommend this to anyone following the thread. It's most illuminating. At about 5.30pm yesterday, I was rather regretting starting this thread, now I'm very glad I did, thanks to the superb contributions from Mr. Charts, SOCRATES and others.

SOCRATES, after Richard has posted the sequel to the HSIC chart, I for one would be very interested in viewing one of your charts that you feel has a powerful story to tell and lives up to the title of the thread. . .
;)
Tim.
 
absolutely richard - my point was just that we need to be very careful that what we are seeing is as close to what we think we are looking at as possible.

commander - x-trader is just a platform for order entry, although it is professional level (i.e. plenty of opportunity for fat finger errors!!) . many brokers and clearing companies will offer it.
 
charliechan said:
hello socrates,

yes - perhaps 'trick' was the wrong word. i hope richard never took offense at that.

i think background however should be taken into consideration, although i do realise that this view contradicts my earlier points about not wanting to be an analyst (my actual standpoint for clarification is that although analysis is useful, i do not think it is worth the consideration most give it. analysis will only cater for around 10% of the success factor, maybe 15% if combined with a set up pattern - if they are used). this is because when we see the background, we can put the move into context. this in turn helps us plan the trade. is this to be a counter trend type scalp, or perhaps if we make it past the daily low or high, would it be worth trying to trail? from the information presented, there is no way of telling. this is why i would rather have the market take me on board when it has made its mind up, rather than trying to out guess the market. this is also why i have a plan to fall back on in case the market tries to sucker me on a fake move.

as a side note, i think we should be VERY careful when using t&s to base decisions on.

i used to rely upon e-signal for my t&s data. then i changed to looking at the t&s data from the x-trader platform. what a difference! i can honestly say that esignnal must have been on valium or something as the prints were no where near the reality that i see on x-trader. who knows, maybe there is also something far superior to x-trader also?? always make sure the t&s is coming from your clearing member, and that whoever is providing t&s data, make sure they dont publish it in bursts as i understand ib do for example. (Lord knows where/how esignal got their data from - perhaps they made it up! the difference WAS that bad!!)
Hello Charlie, probably what you meant was tricky rather than a trick. I understand perfectly what you mean.

The background is very important and gives good pointers up to what unfolds next. But what develops next is a stage set for further development. In this stage there are clues that subtly reveal the intent, the ultimate intent, that is.

For me it is like attending a play in a theatre, when the curtain rises and there is no one on the stage but the scenery is in place. Before the actors appear the scenery gives a glimpse in advance that is not complete, but sufficiently suggestive in its implication to give a solid clue as to what one can expect to see within the context of the backdrop and the props provided.

I therefore do not rely so heavily on the background but more of what is currently developing at the leading edge and then as a gestalt (which is a German word meaning something that is greater than the sum of its parts).

And having taken in this Gestalt I now leave it to talk to me in the sense that I allow it to reveal more deeply how the move is panning out and the distinct direction may become immediately manifest very clearly, in which case there is no time to dither but to snap judge and act.

So you see that the element of mechanical reasoning is over very quickly and now something else replaces it. It is at this juncture that the stop is placed in the sequence of enactment.

This enactment invairiably is correct and comes from the subconscious, and not the conscious mind, as the conscious mind has already played its part by contributing to evaluation and judgement, which is the mechanical part that is now over.

The subconscious is now concerned with the inference, which is an abstract concept and very real. As the stop secures the position against serious loss in case the outcome expected is not the one that suddenly develops, the subconscious is free and is able to carry out the task of taking in the inference and decoding the message drawn from it.

As explained in my previous post there are several things I take in, not one after the other but all at the same time and very quickly.

Whilst all this is going on, I am aware that the clock is ticking. My objective is to beat the clock and for this reason it is imperative not to dither but to committ the millisecond that the price indicates the now. Very difficult to explain because it is very abstract, very far removed from what is mechanical.

Kind Regards To You.
 
charliechan said:
of course, playing guess the direction is the work of an analyst, and i have no intention of everbecoming some paper pushing analyst. as a trader, i know the secret to profit is the correct management of a trade, and myself - not guessing which direction it could go.

happy days

:)

I believe that certain chart patterns repeat themselves and, when seen, must be acted upon very quickly with a tight stop. The quicker you are, the closer one is to the proper (in the trader's eye) level to place that stop. Blind guessing, no. Educated guessing based on previous experience, yes, because that, IMO, is all one can do.

Split
 
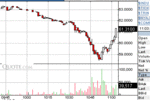
Here is the exit.
Why did I close at this point when the chart showed price was still rushing up?
Although the move was becoming visually over-extended, it is often true price moves further than expected.
Note frugi's rather shrewd comments for a purely chart based assessment.
Sometimes TA works well and not so well within minutes; well as frugi anticipated, not so well when that support at 61 did not turn into resistance.
For me, assessing what actually happens both on the chart AND on the level 2 screens when price reaches a critical level is absolutely one of the keys to consistent profits.
However, price moved beyond as Socrates suspected and when I saw on my level 2 screens that the demand was weakening and supply strengthening the evidence told me the move was about to die BEFORE any sign on the chart.
Result - one of my "classic" chart patterns paid up again with a $1.60 move in under four minutes.
Hopefully others will post some of their set ups too.
Richard
 

Attachments

  • HSICb.gif
    HSICb.gif
    8.9 KB · Views: 320
Mr. Charts said:
Here is the exit.
Why did I close at this point when the chart showed price was still rushing up?
Although the move was becoming visually over-extended, it is often true price moves further than expected.
Note frugi's rather shrewd comments for a purely chart based assessment.
Sometimes TA works well and not so well within minutes; well as frugi anticipated, not so well when that support at 61 did not turn into resistance.
For me, assessing what actually happens both on the chart AND on the level 2 screens when price reaches a critical level is absolutely one of the keys to consistent profits.
However, price moved beyond as Socrates suspected and when I saw on my level 2 screens that the demand was weakening and supply strengthening the evidence told me the move was about to die BEFORE any sign on the chart.
Result - one of my "classic" chart patterns paid up again with a $1.60 move in under four minutes.
Hopefully others will post some of their set ups too.
Richard
Richard, just out of curiosity because I "++++++++++++++" it at 61.4000, it looks from the chart as if a second white candle of similar magnitude was in the pipe and not yet formed, to surge and take it to 62.2000 and I would be interested to know if it did hit it at this higher level subsequently.

Kind Regards.
 
Good afternoon, Socrates,
No, if I remember correctly it only got a few cents higher then fizzled out, dipping back to around 61 and then flatlined for the rest of the day.
Richard
 
Mr. Charts said:
Good afternoon, Socrates,
No, if I remember correctly it only got a few cents higher then fizzled out, dipping back to around 61 and then flatlined for the rest of the day.
Richard
I see, hummm, it ran out of steam then.
 
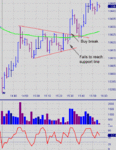
One I did today that reminded me of the threads Chartman used to do. This is a 2min bar chart for the YM.
 

Attachments

  • ym 2.11.05.gif
    ym 2.11.05.gif
    21 KB · Views: 280
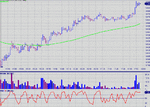
70 points from that. Shame I only took 10 of them :)
 

Attachments

  • ym 2.11.05 2.gif
    ym 2.11.05 2.gif
    87.9 KB · Views: 292
Top