You are using an out of date browser. It may not display this or other websites correctly.
You should upgrade or use an alternative browser.
You should upgrade or use an alternative browser.
Bigbusiness
Experienced member
- Messages
- 1,408
- Likes
- 23
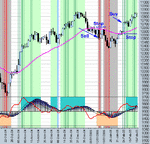
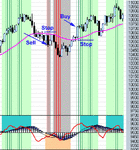
An update to my chart for the Dow posted here:-
http://www.trade2win.com/boards/showpost.php?p=150264&postcount=314
I just watched the first trade and it did move nicely in to profit after a 2 day pull back. If I had entered on the actual signal using a 150 point stop, it would have been a bit scary during that pull back but there would have been an opportunity to take at least 100 points profit and move my stop to break even.
The second trade hasn't pulled back much from the buy signal. I was looking for another 2 day pull back, so I missed this trade and I am now kicking myself 🙄
Attachments
s-a said:You guys are missing the point here.
IMost people have insufficient restraint and are too emotional. Because of this they tend to gravitate towards extremely short-term trading thinking they are reducing their risk by having closer stops, but the reality is.....they are doing just the opposite. It has been my experience that using a wider stop giving your idea some time to work out is crucial - as long as the overall picture still looks good.
HG
I believe that you trade currency as well , just out of interest what are your stop levels set at (no of pips) does this vary with different currency pars and what % of your equity does this (stops) tend to be.
I have re-read this book and have started usingsome of what I think are the main points in the book. Firstly I do not think the indicators in the book are that crucial - as he says any reasonably reliable indicators showing trend will do. I have totally ignored these indicators and started trading curriciencies which I believe to be trending including ones I have never traded before. (eg EUR/CAD) As he says we will never be able to compete with institutions in the knowledge and research they do we just trade the price I know nothing about the EUR/CAD but traded that because it was trending upwards. The other thing I have started is buying on dips for uptrend pairs and selling rallies on downtrend pairs (I used to trade breakouts). The other main point from the book is that I have started holding positions for longer periods (used to mainly day trade) and have wider stops (as he says stops where you think price shouldnt go to if you are right). Having applied the above I am 646 pips up in one week.
Ofcourse its too early to give longer term predictions but already I am a lot happier and comfortable with this style of trading ... only time will tell.
Ofcourse its too early to give longer term predictions but already I am a lot happier and comfortable with this style of trading ... only time will tell.
Good JOB!!! DeskPro. You definitely get it!
The indicators you use are irrelevant. Just have some thing to measure the trend as he describes. Keep yourself a basket of currencies and cross-rates to trade. Buy the strongest and sell the weakest. It works. Keep it simple.
Oh and look at the Eur/Pln. Add that one to your list.
This is a much simpler way to trade because you are not fighting the trend. Like Chick says in the book. The more you do it ---the easier it is to do.
DESKPRO said:I have re-read this book and have started usingsome of what I think are the main points in the book. Firstly I do not think the indicators in the book are that crucial - as he says any reasonably reliable indicators showing trend will do. I have totally ignored these indicators and started trading curriciencies which I believe to be trending including ones I have never traded before. (eg EUR/CAD) As he says we will never be able to compete with institutions in the knowledge and research they do we just trade the price I know nothing about the EUR/CAD but traded that because it was trending upwards. The other thing I have started is buying on dips for uptrend pairs and selling rallies on downtrend pairs (I used to trade breakouts). The other main point from the book is that I have started holding positions for longer periods (used to mainly day trade) and have wider stops (as he says stops where you think price shouldnt go to if you are right). Having applied the above I am 646 pips up in one week.
Ofcourse its too early to give longer term predictions but already I am a lot happier and comfortable with this style of trading ... only time will tell.
Nice work Deskpro.
You and I sound like we have had similar experiences and are moving in similar directions - in fact our weekly profit just from spot FX looks similar too. Outstanding work and I agree, it feels great. I have a basket of 21 currencies that I search for opportunities in several times a day.
HG
DESKPRO said:I believe that you trade currency as well , just out of interest what are your stop levels set at (no of pips) does this vary with different currency pars and what % of your equity does this (stops) tend to be.
I determine my stop based on 2 * ATR(20) off a 240 min chart. With a stop this wide I only have put on a single mini contract (25k worth). I'm still becoming comfortable with stops this size but intellectually I understand that my risk is lower then having a tighter stop. As I move out of the intellectual and truely believe this at the most fundamental level of my existence, I will choose to put on positions ranging from 2-5% of my total equity. Currently I am putting on about 1% of total equity. Some have quite a high ATR(20) off the 240 mins (like gbpchf) which can mean my stop initially sits +130 pips away. This doesn't mean I will exit there, it just means this is the worst I am prepared to have happen and my positions are sized around this value. I will always exit once the line pattern appears no good anymore.
Hope this answers your questions.
HG
Bigbusiness
Experienced member
- Messages
- 1,408
- Likes
- 23
timsk said:Sorry to go off topic but I'm compelled to ask Bigbusiness if his chart is available as wallpaper as I'm keen to re-decorate my bathroom. Very pretty!
:cheesy:
Tim.
LOL. Perhaps I am in the wrong business. I prefer a bit of Jackson Pollock myself 🙂
JFK
Member
- Messages
- 71
- Likes
- 0
Hi BB,
Did your trade stop a day or so after you posted your chart on the 17/02/05?
(my next question is a bit of a cheek I know) Has your short signal already started?
I haven’t bought the book yet, but it does appear to be what I am looking for to fill in a few blanks to the strategy I am trying to achieve for EOD.
Thanks
Bigbusiness
Experienced member
- Messages
- 1,408
- Likes
- 23
JFK said:Hi BB,
Did your trade stop a day or so after you posted your chart on the 17/02/05?
(my next question is a bit of a cheek I know) Has your short signal already started?
I haven’t bought the book yet, but it does appear to be what I am looking for to fill in a few blanks to the strategy I am trying to achieve for EOD.
Thanks
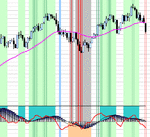
I have attached the updated chart after the close today. The stop wasn't hit but I didn't do this trade. No sell signal at the moment..
Attachments
Bigbusiness
Experienced member
- Messages
- 1,408
- Likes
- 23
JFK said:Thanks BB,
When you were back testing Chick's method, did you find that most of the false signals came on the week that contracts expired?
My method of back testing is a bit unconventional. I just go through the charts and mark all the trades and record the profit and loss. It takes a long time but I prefer it to just using data.
I don't think options expiration weeks make a difference. The false signals are at different times of the month. I think by using a few rules like only entering longs if the ML is above 0, there are not too many false signals. It is still early days for me using this method and I have not entered the first two trades I have observed. I am more used to intra-day trading, so I thought it would be a good idea to look at a few trades as they happen before using real money.
Bigbusiness
Experienced member
- Messages
- 1,408
- Likes
- 23
JFK said:Thanks BB,
What about signals given the week after option expiry? Are they common?
Are there any other members that wish to comment?
Once again thank
100
I can't see any link between options expiration and failed signals. There was a short signal on my chart at the close last night but the ML is above 0 and the SL is at a point where it has reversed before. The moving average has only just turned negative, so there are plenty of reasons why this one might fail.
Attachments
at the rtiskm of going slightly off topic - have just finished goslins book and was very impressed but was slightly confused about the counting back strategy utilised to determine the trend .
I use a 20 sma line intsead of a 50 with a 3/10/16 macd - should i be counting back 20 days to reconvene my medium line and what will that tell me for the next few days trading ?
I use a 20 sma line intsead of a 50 with a 3/10/16 macd - should i be counting back 20 days to reconvene my medium line and what will that tell me for the next few days trading ?
liamfitz said:...was slightly confused about the counting back strategy utilised to determine the trend .
I use a 20 sma line intsead of a 50 with a 3/10/16 macd - should i be counting back 20 days to reconvene my medium line and what will that tell me for the next few days trading ?
The basic idea of the counting back thing, is useful if you think the trend line may change ie. It is flat at the moment, but you are wondering if it will go up, down or stay flat in the next few days.
You look back 20 days as you are using a 20 day average, and if you are not using daily charts, then replace the word 'days' with 'bars'.
OK, so an average is made up of all the prices in the range (20) then divided by 20, to give the average. This average is recalculated every day as a new day is added, and an old one - now 21 days ago is dropped from he equation.
IF, the price in the next few days remains at the same level ( it might if the TL is flat) then we know that there will no no change in the calculation of the new days, the change in calculation will be from the ones dropping off the end.
OK, this is all pretty much guessing, but this is the way it goes.
We then look back 20 days as that is where the change in the calculation is going to happen. If we drop off higher numbers eg 20, 19 & 18 are higher than 17, 16 & 15 - then the TL will move down as the calculation will yield a lower figure.
I am not sure if I just clarified that or made it more muddy 🙄
Anyway, yes look back 20 days. If the last few days are higher than the next few then the TL should head down (providing as we guessed, the next few days are about constant).
The opposite is of course also true, if days 20, 19 & 18 are lower than 17, 16 & 15 then the TL should head up.
Confused? You will be after the next episode of SOAP 😕
Many thanks for that Ardhill - its a lot clearer now believe it or not . Nevertheless I do have another question which I hope is simpler - is Goslins method better suited to futures and indices rather than stocks - I ask this for a particular reason in relation to yesterdays rise on the dow, nasdaq and spx .
The stocks which im looking at azn, aal , emg on the ftse etc whereas they are bearish by the three point system (2-2.5 points minus ) will all go plus today - in effect just by a rise in the spx- -Goslins method is wrecked . So the ystem is best suited to fx , indices , futures ?
Any thoughts on this ?
many thanks for your previou 😆 s help !
liam fitz
Similar threads
- Replies
- 24
- Views
- 14K


