"Trading Day by Day" by Chick Goslin

I have been going through charts I have made for the Dow and using some rules e.g. only entering longs if the ML is above 0 or is highly likely to be in the next day or two. I also tink it is worth using a fixed stop to start with, taking some profit and then letting the rest ride, trailing the stop for the rest of the position.

Looking at the charts and working out my entry and exits in this way, I can see 12 trades between 2/12/03 and today. I estimate these trades would have made around 2,380 points, if I stuck to the rules. Obviously there are some subjective decisions involved and I haven't allowed for my possibly poor implementation of the rules but I do think most of that profit would have been possible.

The table below shows (1) the half of the position when I have taken 100 points or been stopped out and (2) the other half that I tried to leave until there was an obvious point to close the trade.
 

Attachments

  • results.GIF
    results.GIF
    5.9 KB · Views: 509
TGM said:
Chick's market letter is based on a STRICT interpretation of the lines. You cannot use it as a 'blind' buy and sell letter to make bundles of money. It is a TEACHING newsletter to make sure you understand status.....
TGM,
Thanks for all these extra points, I might call Chick one day.

Just to point out,
when you say that Chick follows a STRICT interpetation of the lines, I think you mean he always considers the lines but sometimes trades in a different direction.
Here is an example from todays letter:
" Lines say sidelines in all three stock indexes, but
continue to prefer against trend shorts."
 
" Lines say sidelines in all three stock indexes, but
continue to prefer against trend shorts."

I can understand trying to get in a bit early but my LL on the Dow is still pointing slightly up and it is a shorter ma than the 49sma. The ML is above 0 and looks like it will turn negative but the SL is now turning back up. Doesn't look like a good time to be short if you want to use this method. The book does bang on about trading with the trend and I would have hoped he would stick to that.
 
This trend is getting tired though, it is clear to see. Last concurrent up signal has now been more than retraced - take that as a warning. The ML is WAY lower then the last ML up cycle and we are set for a solid ML down cycle here. Over the next 2 weeks the TL will really start to flatten as we will be taking off those days of rapid acceleration higher. I agree the SL is curving up and is the area of recent SL lows so odds are good IMVHO for some minor up. The ML cycle looks to negative for me to focus on longs if I was just trading this daily chart.

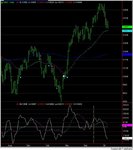
See what I mean. The white dot is price 49 bars ago. The vertical line on the 3-10-16 shows the SL 16 bars ago. Also quite obvious bearish divergence on the SL at the peak.

Market is (and has been) giving some short term clues here. Chick does talk a lot about trading with the trend but he does also talk briefly about trading against the trend and says there is nothing wrong with doing so, just your odds are usually reduced. He also says trade much smaller positions and be less patient with your position then you would be if you where trading with the trend. All his experience must be telling him something.

HG
 

Attachments

  • ym_daily.jpg
    ym_daily.jpg
    84.5 KB · Views: 622
SL + ML Scale

I got the book last week and I'm enjoying it very much. Thanks very much for the recommendation from various members of the group.

So far I've managed to program the MACD 3-10-16 and the MA 50. Nothing fancy, pretty basic stuff. 🙂

However, looking at the charts in Chick's book and the SMR charts on their site (check out http://www.smr.com/NOGRIDBOOKSTK.pdf for examples), I noticed that the SL and ML components are set in a +40 to -40 pane for all charts.

It's not the biggest deal in the world, but if anyone can help translate the 3-10-16 into the SMR scale, I'd appreciate it. It doesn't seem to be a pure percentage transformation... It's useful to be able to use the same scale for all charts to compare SL and ML in a relative sense.

Thanks!
 
cclee,

I can see what you are saying, but I don't know how useful it is. What is important is how the SL is behaving relative to the recent past. Each instrument has specific volatility characteristics and these change over time. Comparing the location of the SL in one instrument to the SL reading of another instrument is useless. Just like comparing areas of SL movement yesterday with that of 1 year ago. Know what I mean?

HG
 
cclee said:
I got the book last week and I'm enjoying it very much. Thanks very much for the recommendation from various members of the group.

So far I've managed to program the MACD 3-10-16 and the MA 50. Nothing fancy, pretty basic stuff. 🙂

However, looking at the charts in Chick's book and the SMR charts on their site (check out http://www.smr.com/NOGRIDBOOKSTK.pdf for examples), I noticed that the SL and ML components are set in a +40 to -40 pane for all charts.

It's not the biggest deal in the world, but if anyone can help translate the 3-10-16 into the SMR scale, I'd appreciate it. It doesn't seem to be a pure percentage transformation... It's useful to be able to use the same scale for all charts to compare SL and ML in a relative sense.

Thanks!


They do this to make the chartbook look uniform. Each of the charts and the indicators in their chartbook are set to the same number of days etc.. I have subscribed to SMR charts for 10 years. I have also employed them to do custom charts for me. They do them all the same. If you look at their update numbers you will see plots that go off of scale. For instance you could see a SL at +70 and an ML at +49---this happens.

Having a constant scale for electronic charting (like the indicators S-A and Kiwi put up on these boards) would not make a difference (in regards to applying the method). It is good to watch for breakouts in momentum. For example, in the YM chart S-A posted, you have a clear momentum breakout --to the downside for SL just recently.
 
Hi all,

Been spending a good deal of time looking and testing goslins MA - it does work !

For all metastock owners I found another indicator (from his previous book):

{based on ideas gotten from Chicks book - INTELLIGENT FUTURES TRADING,
published 1997 by Windsor Books, POBox 280, Brightwaters, NY 11718,
and published in TAM Dutch TA-magazine, Jun98}

MTMidM1:= Input("MidTerm periods MEDIAN price x-days ago", 1,1000,47);
MTMidM2:= Input("MidTerm periods MEDIAN price x-days ago", 1,1000,48);
MTMidSMO:= Input("ShortTerm SMOOTHING periods MEDIAN price", 1,1000,1);
Mov(
((Ref(MP(),-MTMidM1)/2.1) + (Ref(MP(),-MTMidM2))/1.9),
MTMidSMO,S)

{This indicator is copyrighted by and propriety of Ton Maas - Amsterdam - the Netherlands}

Thanks
 
This has been an interesting thread so much so that it has caused me to part with some cash and purchase the book. Like a "chinese whisper" IMO people will interpret the contents differently. I would like to ask TGM or s-a, when Chick takes a trade is he influenced by what the index is doing.?
 
hi eddyjo,

You will enjoy the book - best investment I have made so far with the possibility of infinite reward. Now that is a R/R I like 🙂

I think that is a tough one. We don't trade in vacums so it is probably hard not to be influenced by other instruments. I have seen Chick make mention of what other highly correlated markets are doing in relation to another. I've personally succumb to that quite a lot in FX and in my experience it has usually been to my detriment. Right now I am experimenting with using these situations as a way to help my position sizing but still trade purely on the technicals of the one I'm trading. Just something I'm experimenting with.

HG
 
Yahoo group

Anyone interested in starting a Yahoo group concentrating on Goslin trading techniques? We can share charts, analysis, the more experienced can pass on some lessons, etc etc...
 
Well here's mine.

I have just had a sell signal for the Dow on the daily chart I have been working on. This is my first time uisng it, so I will just observe what happens. So it will probably fall like a stone from here and I will be kicking myself .

As you can see, I have moved on from 'no indicators' 🙂
 

Attachments

  • 12.1.05.gif
    12.1.05.gif
    51.5 KB · Views: 695
Last edited:
Sell signal

Bigbusiness said:
Well here's mine.

I have just had a sell signal for the Dow on the daily chart I have been working on. This is my first time uisng it, so I will just observe what happens. So it will probably fall like a stone from here and I will be kicking myself .

As you can see, I have moved on from 'no indicators' 🙂


Okay,, i assume the red line is the SL,, it has just turned down and I assume you are taking that as a sell signal,,,,,,,,,, along with price being under the 49/50 ma.

My view on your pic is that the 49/50 is Basically flat, (not good) and you have 2 lines in your indicator + a histogram. Me confused,,

My thoughts are to wait till sl rises one more time and take the next sl downturn as long as the other lines indicate the same scenario.

Sound good?
Panman
 
My take is to agree with panman but for slightly different reasons.

If I count back 49 bars I see that prices were about this level for a few bars in a row so constant price over the next few days wont cause the TL to fall. And a rise will be "bad". More worrying to me would be that with all that support the chances of a bounce are probably quite high ... so if I was going to enter I would look for a limit nearer to todays highs for part of my total position ... then see what happens.

But I wouldnt be surprised if I ended up buying into a break out (down) either.
 
Bigbusiness said:
Well here's mine.

I have just had a sell signal for the Dow on the daily chart I have been working on. This is my first time uisng it, so I will just observe what happens. So it will probably fall like a stone from here and I will be kicking myself .

As you can see, I have moved on from 'no indicators' 🙂

Man, I really love your charts. Its cool how you can make excel do things like that. I'm totally blown away. This will show the subjective nature of this method as likely that everyone else will have a different view on your trade. Kudos for having the courage to post your own ideas on a trading forum.

I personally believing in jumping the gun a little here 😉 Why do I want to jump the gun? Trend to me looks shakey. If we get down to 10400 in the next couple days the trend could very easily turn down in the next week to week and a half. We have some divergence on the ML and the fact that the last concurrent buy signal has been fully retraced gives me caution to the upside. We had solid bearish divergence in the SL at the recent high which just preceeded the ML DOWN cycle that we are in now. The ML will remain pretty solidly down for at least the next 5 days and right now we have a lovely little hook back ( 😉 TGM) in the SL - fairly classic pattern for continuation. The oversold SL was worked off as price just slowly slide lower, you'll see this a lot when the price energy really wants to keep moving but is trying to catch its breath a little. So I think light anticipation here is fine here personally.

Just my take - everyones will probably different. Have confidence in your ideas. In the end it doesn't matter at all what others think of them, only what you think of them.

HG
 
Thanks for the replies. Just to clarify the chart a bit, for the lower indicators, the red line is the SL, the histogram is the ML and the faint black line is a shorter period ML.

I don't use the 49sma, my moving average is one that I have worked on from Jim Sloman's Ocean Theory book.

It takes a while to work out how to use excel but it is great for making your own customised charts. I learnt how to do these charts from here http://www.geocities.com/jonpeltier/Excel/Charts/index.html

Does look tempting to go short from here but I will see if there is a better opportunity.
 
Profit taking for stocks?

Hi all,
How does the "percentage of margin" profit taking rule work for trading stocks? Does anyone have any ideas?

Thanks!
 
On the 1/2 hourly figures I got whipsawed yesterday.
I had an up bet at the pre-opening but changed to a downbet after the market fell 50 points, only for it to go right back up and more !! 😱
This may be the system's Achilles' heel !??
 
Last edited:
Back
Top