The oil thread

I trade it soley using candlesticks, pivot points, and volume. Sometime especially here lately it is like a slot machine that cannot miss. I also employ stochastics. With the volatility of the market right the the price swings are phenomenal to take advantage of.


How are you using stochastics? To find dips/best entry points?

Anyway, I guess one day it's going to break right out of those swings one way or another, and personally, I haven't a clue which way.
 
I use it solely as a overbought/oversold indicator to help confirm the candlestick patter. I will look for a key support level followed buy an oversold signal from stochastics where there is a solid candlestick reversal pattern on strong volume at the point i make my buy order with a stop loss a few cents under the key support level so i won't get stopped out hopefully. lots of laughs
 
I think it will be a break to upside once the economy straigthens out. I think we have seen the lowest point for awhile
 
I'm not totally convinced Stochastics can tell you anything that price isn't already telling you, but if it's working for you....
It didn't seem to work for me (this was not on oil).

I have a theory (unproven, untested) that (some) indicators (used correctly), may work better for the seasoned pro who already knows charts and price action patterns backwards. For the relative newcomer, they may serve more as a distraction from learning about price patterns.

(I'll let you know when I become a seasoned pro in 6 or 7 years or so :) ).

Anyway, I agree that once world economies start taking off again, oil will shoot up, as will many commodities.
 
I'll be honest with ya I think the so called seasoned pros are extremely overrated. I never listen to what the guys on cnbc say all they are there for is to promote a stock or commodity for their company.
 
I use it solely as a overbought/oversold indicator to help confirm the candlestick patter. I will look for a key support level followed buy an oversold signal from stochastics where there is a solid candlestick reversal pattern on strong volume at the point i make my buy order with a stop loss a few cents under the key support level so i won't get stopped out hopefully. lots of laughs
Sounds like my trading "plan".
Fibbonacci, Elliot Wave, and Goodman Swing determine the "key support levels".

Happy trading,
AC
 
Oilwatch Monthly reports that despite significant cuts “supply is still significantly higher than demand.” On March 15, “OPEC agreed that no further oil cuts in oil production will be made and that it will focus in the coming months on complying with previously announced cuts of 4.2 million bpd – 80% of which has been achieved to date in circumstances where OPEC’s price target of US$70 has not been achieved, and where OPEC now thinks it ‘has to live with’ a US$42 price.”

Today's drilling results
 
guys , what is the best marketmaker to scalp crude oil ? no requotes no rejections , i want MM that fill u anyway ( jump in ) ofcourse there will be some slippage , what about FXPRO ?
 
Don’t expect low oil prices to last, says Jeff Christian of the Stock Research Portal Newsletter. He expects $60 to $65 is a “reasonable target” for late 2009. And given an economic recovery, “There is not enough energy to supply what is anticipated in terms of real GDP. That means oil prices go back over $100 in a three-to-five year time frame and possibly a lot farther.”
 
Just thought I'd post up a daily chart of oil, looks like the previous resistance around 4800 has turned support with the current resistance level being around 5400-5500.
I think a break above resistance could see us moving up to a minor resistance level around 5600, then onto 6000.
A definite break below support could see us moving back into the mid 40's.

I haven't been trading oil recently due to the massive volatility that we've been seeing since the beginning of april. Although that seems to have calmed down over the past few days.

Just my 2p :)
 

Attachments

  • oilchart.jpg
    oilchart.jpg
    122 KB · Views: 151
Ok, we were being held up at the 50 day SMA, blew through that, now being supported at $49.00

If we go south of there then the next really strong support level looks to be at $48.00

EDIT: meant to say, thats a 15min chart
 

Attachments

  • Untitled-1.jpg
    Untitled-1.jpg
    111.7 KB · Views: 126
I'm going to say that this should come off this morning. It's 50.30 in June Brent right now. API figures show big builds.

Could all change come this afternoons figures, but in the short term, it's a sell for me...
 
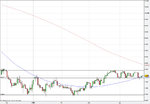
Looks range bound for the moment, the range is getting narrower and narrower though.

[useless comment] Its gonna make a big move soon I think, although I have no idea in which direction! [/useless comment]
 
Well I wasn't right! Confused as to why we've moved up, even if it's only slightly. I guess just weaker dollar and the consumer confidence stuff. US GDP data soon. Hopefully that should spring some life into things!

Thought that reported death of a baby in Texas from Swine flu would have had a more bearish impact, but hey ho!
 
Top