14ma
Hi lost_boy -
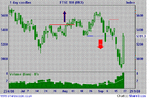
This means 14 day moving average, that is, the average closing price when calculated over the last 14 days' closes. When plotted on a chart it smooths out the price fluctuations. I've plotted it on the FTSE100 chart for the last 6 months using Sharescope. The index closing prices are represented by the black line, the blue line is the 14MA.
It is actually the 14-day Simple Moving Average, meaning that all 14 last closing prices are summed in the calculation, divided by 14, to give the average's current value. An Exponential MA gives greater weighting to the most recent prices of the 14, as they are probably more relevant today.
As a newbie, you will be told its easy to trade - buy when the price (or another value MA) breaks up through a given MA and sell when it cuts it downwards. This looks seductively good on a historic chart - e.g. look at what you would have gained if you sold at the cross-over on 20/05 - the index dropped over 1,000 points by mid-July. In reality, it is nothing like so easy and it carries significant risk. Look at the plot after 16/07 - you would have bought, sold, bought, sold, bought, sold, incurring overheads and risk each time. No good.
Study this site and ask the experienced people on here. I don't know if any of them are millionaires from trading, but there is a huge amount of knowledge amongst the users.

