Stan Weinstein's Stage Analysis

Thanks, Isatrader. I will have a look at this document. I am a software engineer in my day job, so don't mind getting my hands dirty with some programming.

I am also in contact with their support team in ProRealTime so can pick their brains also.

When you say...

...isn't the Mansfield Relative Performance a standard indicator in ProRealTime?

Thanks, that would be a big help. The Mansfield Relative Performance is available in ProRealTime on the charts, but I think it was added in and so isn't available in the ProScreener which only picks up the default indicators which are part of the code.
 
UK FTSE 350 Stocks and Sectors Relative Performance

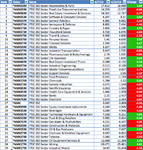
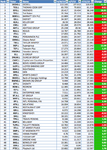
Below is the updated the weekly FTSE 350 stocks and sectors relative performance tables

FTSE 350 Sectors by Overall RS Score

FTSE350-Sectors-RS_12-7-13.png

Top 50 FTSE 350 Stocks by Overall RS Score

FTSE350_RS_top50_12-7-13.png

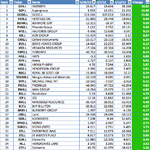
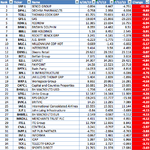
Also attached below is the biggest moving FTSE 350 stocks since last week by their Mansfield Relative Performance figures.

FTSE 350 Gainers

FTSE350_RS_top35_12-7-13.png

FTSE 350 Fallers

FTSE350_RS_bot35_12-7-13.png

To view the entire FTSE 350 stocks in the spreadsheet click the following link: FTSE 350 Stocks RS.xlsx and use the tabs at the bottom to see the different views by overall relative strength or by weekly RS change.
 
Re: UK FTSE 350 Stocks and Sectors Relative Performance

Thanks for the charts, isatrader.

About the proscreener tool in ProRealTime being able to work with the Mansfield Relative Strength/RSI Comparison indicator, having been in contact with ProRealTime over the last week, they say the proscreener only works with the standard RSI indicator. So it doesn't work with any custom indicators, or even their own Relative Strength Comparison indicator. This isn't even available via the programming interface.

What made you assume that it was able to run proscreener, via the programming interface, on custom indicators?

Tryst

As you said it was an assumption that it could be coded because it works with their built indicators like the RSI. Take for example the code to screen for a RSI value below 30:

Code:
MyRSI = RSI[14]

Filter = MyRSI < 30

SCREENER[Filter](MyRSI AS "RSI")

All that does is define the indicator to be used i.e. RSI[14] and then applies a rule to it, and then tells the screener to display it in the last column. So I assumed if you defined the custom indicator in the first few lines somehow in proper ProRealTime code then you could get it to work. But the general idea would be something like the following:

Code:
StandardRS = (stock_close / index_close ) * 100

MansfieldRS = (( StandardRS(today) / sma(StandardRS(today), 200)) - 1 ) * 100

Filter = MansfieldRS > 0

SCREENER[Filter](MansfieldRS AS "Mansfield Relative Strength")

Obviously the first two lines are not the correct code for ProRealTime, but that's all it is, so that's why I assumed it could be done.
 
Re: UK FTSE 350 Stocks and Sectors Relative Performance

Thanks, isatrader. Was checking just in case another proRealTime worker told you it was possible 🙂
 
Re: UK FTSE 350 Stocks and Sectors Relative Performance

Thanks, isatrader. Was checking just in case another proRealTime worker told you it was possible 🙂

No worries, and the usual chart updates are now on the other Stage Analysis thread, as I left it late this weekend as it was so nice.
 
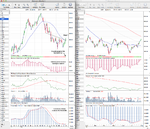
Apple (AAPL) is starting to show signs that it is forming a Stage 1 base, with a higher low at the end of June and this week it broke above it's still declining 30 week SMA. I've highlighted that the 30 week SMA is declining, as people might be tempted to call a Stage 2A breakout if it moves above the recent swing highs - which it's very close to. But it's not Stage 2A until the 30 week SMA turns up as well, and so it will still be classed as in Stage 1 imo.

The price action turned the more sensitive 30 week "weighted" MA up for the first time since October and the technical attributes score improved from a 2 last week to a 4 out of 9 this week as you can see on the attached SATA chart.

AAPL_SATA-W_2-8-13.png

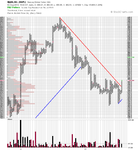
The technicals are improving for AAPL, with relative performance finally beginning to pick up a little and volume, although looking quite anemic, has actually moved above it's moving average on the cumulative volume and also attached is the traditional scale point and figure chart which shows that the price has moved above the long term down trend line.

So I'm upgrading my previous rating of Stage 1A to Stage 1, which by the definitions of the method means "the basing phase - may begin accumulation". Attached are the charts.
 

Attachments

  • AAPL_W_2-8-13.png
    AAPL_W_2-8-13.png
    127.2 KB · Views: 403
  • AAPL_PnF_2-8-13.png
    AAPL_PnF_2-8-13.png
    52.8 KB · Views: 340
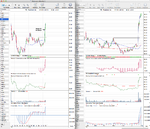
Facebook moved into Stage 2A last week, and the technical attributes score is a maximum 9 out of 9. Attached is the weekly and daily charts.
 

Attachments

  • FB_W_2-8-13.png
    FB_W_2-8-13.png
    115.1 KB · Views: 372
  • FB_PnF_2-8-13.png
    FB_PnF_2-8-13.png
    20.9 KB · Views: 310
Last edited:
Thanks for the charts, isatrader.

What moving averages are showing on your weekly AAPL chart that has the technical scores on? As you have three moving averages in your technical scores and only two on the charts showing?

Re. facebook, would you wait for a pullback here? That GAP up is just wild. I'm assuming it is a break away gap and my potentially never ever get filled (pending an obviously 2007 style crash).

The moving averages shown on the chart are the 10 week simple moving average and the 30 week simple moving average. But on the technical scores I also include the 30 week "weighted" moving average, which is more sensitive to the recent price action as I've found the weighted moving average is very useful for helping to identify when a stock moves into Stage 1 or Stage 3 as it will go quite flat during those periods, whereas the 30 week SMA will still be rising or falling until the Stage is almost complete.

With regards to Facebook it is a huge gap, so my personal preference would be to watch it for many weeks and see if it pulls back to test the breakout support in the low 30's and how it reacts around there to get a lower risk entry, as the key ingredients are there for a decent Stage 2 advance, but any entry currently is very tricky and as you said there's also the chance that it might not pullback, as the A+ breakouts don't always. It's a difficult one.
 
This is a great thread! I will be following this strategy just as soon as I can get some information on a decent broker and I'm able to create my own threads.
 
Hi isatrader, it's been a while since you posted. Are you still following this style of trading?

I moved the thread to it's own website as it was getting too big for a single thread on here. So Google Stage Analysis Forum and you'll find it.
 
What broker and charting tool do you use?

Charts and brokers are all dependent on what you want to trade. Weinstein's method is a medium to long term method mainly suited to stocks, so I get by with charts from stockcharts.com for US stocks and prorealtime.com for UK stocks and I mostly do investor positions in my SIPP account with Sippdeal.

For short term traders in the UK, IG Index or any other spread betting or CFD firm should do the job for brokers, but you don't need the broker charts for the Stage Analysis charting, which instead can be done on free charting services like prorealtime.com which enables you to add the very important relative performance versus the market on the charts, volume and also allows you to set up scans to narrow your search down. For example a simple scan I run each night is to look for stocks that traded more than two times their average daily volume, and then I manually go through the charts to find any stocks that match the criteria I'm looking for - i.e Stage 2 continuation moves, Stage 2A breakouts etc.
 
Last edited:
Thanks, I will mainly be looking at medium to long term trading for stocks so was looking for the cheapest way to do this. Spreadbetting is not for me and would only want to trade the real stock markets instead of what a spread betting firm sets it to be.

Have you come across any cheaper brokers for the type of trading I want to do by any chance? Thanks for your help so far.

The cheapest way to trade actual stocks would be Interactive Brokers I believe, but if you want to trade in a SIPP or an ISA then Sippdeal has been ok so far for me, and I didn't have any problems with Selftrade either.
 
Last edited:
I've had a look into an ISA on Sippdeal and also looked at trading actual stocks with Interactive Brokers. Both look good. I had a look at the demo on the ISA and there is a stamp duty to pay on top of the deal fee. I can't seem to see if this is the case with Interactive Brokers with trading actual stocks.

I will be looking at putting in £100 a month to begin with for a year or so to get used to it all as I don't mind losing that much. I won't reach the maximum ISA limit so both options are open to me but can't decide which would be cost effective. Does Interactive Brokers have other costs other than the flat fee of £6 per trade?

Any advice or guidance?
 
Back
Top