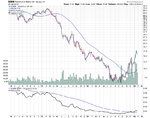
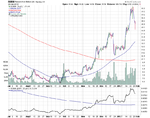
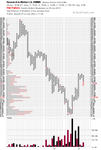
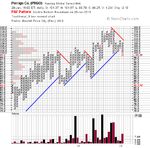
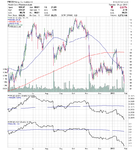
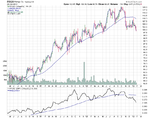
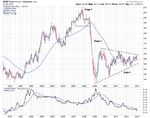
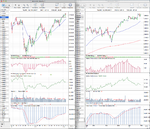
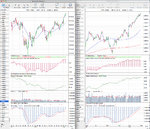
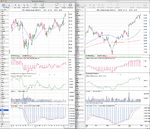
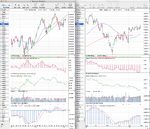
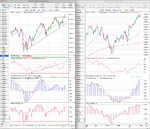
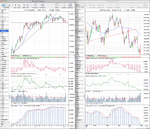
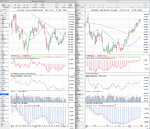
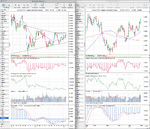
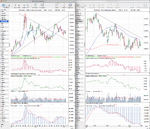
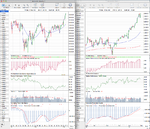
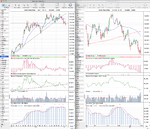
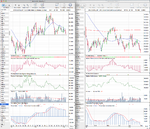
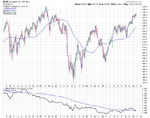
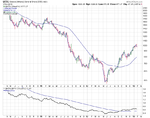
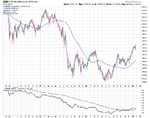
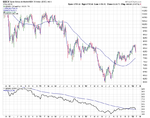
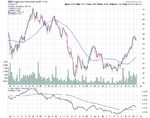
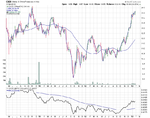
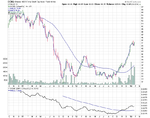
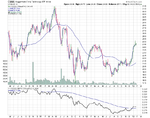
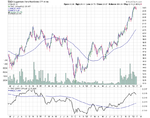
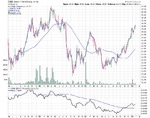
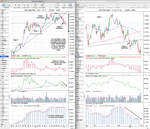
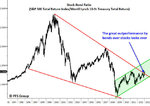
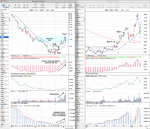
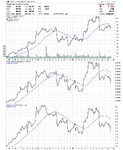
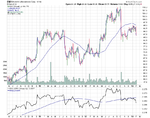
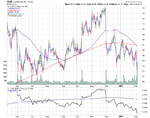
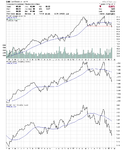
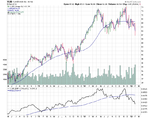
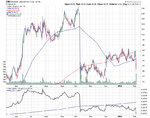
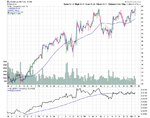
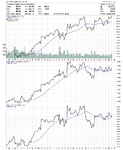
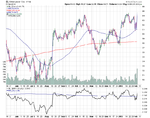
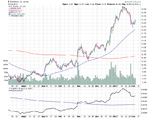
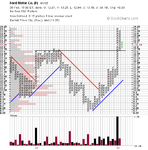
Attached is the updated major charts and the relative performance table. I've added in some additional Index charts from Europe this week, as the short selling ban was lifted in Greece and Spain during the week ,so I thought it would be interesting to see how they are progressing in their Stage 2 runs.
Also, as usual I've updated the market breadth charts, so that we can see what the weight of evidence is currently suggesting:
http://www.trade2win.com/boards/technical-analysis/147476-market-breadth-25.html#post2066248
Notes:
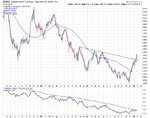
The Shanghai Composite (SSEC) broke above it's downtrend line fairly convincingly and so should be considered in early Stage 2 now. However, it's rapidly approaching it's two previous major swing highs from early 2012 in the upper 2400s and another from 2011 at 2536 and so it could meet further resistance in that zone.
The Greece, Italy and Spain charts all had a reversal this week. They are in Stage 2 but came under pressure from the lifting if the short selling ban.
US stock indexes all continued higher after a week of heavy data. Negative GDP was virtually ignored, and the markets continued higher on Friday's following strong revisions to the previous months jobs data. All the major indexes are now in Stage 2 again including the lagging Nasdaq 100, which has been held back by Apple's weighting in the index.
The Dollar Index (DX) continues to attempt a continuation move in Stage 4B, and is very close to the horizontal breakdown level. There is a head and shoulders pattern on the daily and weekly charts, and it looks to be setting up the breakdown further below the major resistance from the relative performance and the cumulative volume. But the support could still hold yet, as it has done many times previously.
US Treasuries have broken down convincingly into Stage 4 now and saw a volume pickup this week, especially on Friday as they surged higher immediately following the jobs numbers as people tried to bottom pick at the headline 2% yield level. This was short lived though as they fell back just as strongly to close the week at a new 52-week closing low. I've revised my swing targets to 127.80 on the 10 year and 136.69 on the 30 year.
Crude Oil (CL) managed to get back above it's zero line this week which is highlighted on the relative performance table with the green arrow, and looks to be targeting the next resistance at the 100 level.
I spoke on last weeks update about Copper (HG) beginning to interest me due to the increasingly squeezed price action within the Stage 1 range. This was resolved this week with a breakout close above the downtrend line. It still has near term resistance to clear, but I consider it a decent trader entry point as it's now in Stage 1B and has around 3x ATR(200) risk to the stop position below the recent swing low. So I'll be looking for an entry point at the beginning of the week.
Gold (GC) is another chart showing a squeeze in the price action and has been trading around the flat 200 day MA since mid December. I consider it in Stage 1- as it's in a short term downtrend within it's Stage 1 range and briefly made a Stage 4 breakdown before reversing quickly the same day back up into the Stage 1 range. I took a speculative long position in Gold last week as the Palladium trade I took on 21st January is working out well so far in it's early Stage 2 run, and is strongly correlated to Gold. So due to being able to have a tight stop below the recent range, I thought it was worth the additional risk on top of the palladium trade.

