Stan Weinstein's Stage Analysis

looking at the chart i meant july..
do you broadly agree with my chart

Yep it looks almost there. Although during the 2010 Stage 3 area on your chart it dipped into Stage 4 briefly and then had a brief stage 1 before breaking out into a new Stage 2.
 
have you got a detailed stage analysis chart including 1a 3a etc etc..i found one the other day but can't find it now..
 
have you got a detailed stage analysis chart including 1a 3a etc etc..i found one the other day but can't find it now..

Here's the breakdown of the stages:

http://www.trade2win.com/boards/technical-analysis/134944-stan-weinsteins-stage-analysis-3.html#post1695880

There isn't a diagram showing 1a, 1, 1b etc - just the simple diagram of the four major stages. So how I've been learning the stages is looking at the global trend alert newsletter from 2005 here:

http://www.trade2win.com/boards/technical-analysis/134944-stan-weinsteins-stage-analysis.html#post1675626

As it has the whole S&P 500's stocks from Feb 2005 stages, plus all the sectors. So you can look back in your own charting software at the hundreds of individual stocks and will then know what to look for better.

Hope that helps
 
cool. thanks.. you did want someone to correspond with..hope i not going on toooooo much....
you watching anything?
wopuld you agree ATK is similar to aml..on daily needs to clear 640, and on weekly about 1a?
 
cool. thanks.. you did want someone to correspond with..hope i not going on toooooo much....
you watching anything?
wopuld you agree ATK is similar to aml..on daily needs to clear 640, and on weekly about 1a?

No worries, it's good to talk to someone about it. Like I said it will help me focus and learn myself as I think you always learn better in an interactive manner. Although I do have to pop out for some physio in a bit, so will be offline after this for a few hours, as I have a broken collarbone at the moment.

Precious metals are my main focus at the moment. There's a short covering rally today across the board so I'm watching how they react at key resistance levels this week.

ATK.L does look similar to AML.L - the weekly is on the 30 week MA, but needs to have a good close above it to move into Stage 1A, as it's at the critical point where it can easily reverse to continue in Stage 4.

On the daily 640 looks a good level to clear, but look at the weekly as there's some strong resistance there from January's low, so that might take a while to overcome as the resistance is within the last year.

Relative strength and volume are more positive than AML.L though.
 

Attachments

  • ATK_weekly_25_11_11.png
    ATK_weekly_25_11_11.png
    121.6 KB · Views: 454
  • ATK_RS_weekly_25_11_11.png
    ATK_RS_weekly_25_11_11.png
    115.7 KB · Views: 404
  • SupportServ_weekly_25_11_11.png
    SupportServ_weekly_25_11_11.png
    111.9 KB · Views: 405
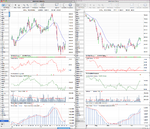
I noticed both of your picks are stocks that have fallen hard like the market has and so have resistance to fight through still. A big component of the method relative performance versus the market. You want to buy strength and sell weakness, so I'll give you an example of one of my current trades to illustrate this. The market trend was down when I bought this, so it breaks the rules a bit, but I think it's a good example of a good relative strength stock breaking out and currently retesting the breakout level. It might fail because the market is still negative, but has potential to move higher because of the size of the base and lack of resistance above it.
 

Attachments

  • RR_weekly_25_11_11.png
    RR_weekly_25_11_11.png
    121 KB · Views: 415
  • RR_RS_weekly_25_11_11.png
    RR_RS_weekly_25_11_11.png
    123.6 KB · Views: 443
  • Aerospace_weekly_25_11_11.png
    Aerospace_weekly_25_11_11.png
    122.9 KB · Views: 425
ouch. my mum broke her shoulder a 6 weeks ago, and they unable to even consider operation for another 6 weeks.. 🙁
i can see why you bought rr. the other day.
 

Attachments

  • rr..png
    rr..png
    33.8 KB · Views: 462
what you think of this as a potential traders entrance... had a 4 then a pullback to 30wma.. now if starts falling dsay below 350 with stop above 383?
 

Attachments

  • pmo.png
    pmo.png
    33.3 KB · Views: 453
wat you think to ppc? on weekly broke out stage 1?, then pulled back, now looking to go off again.
only thing is breakout volume was low?
do you find uk volume on breakouts work? i must admit in all years i traded ive ignored it as there not a lot of it in general unlike usa shares
 

Attachments

  • ppc1.png
    ppc1.png
    35.2 KB · Views: 442
  • ppc2.png
    ppc2.png
    28.2 KB · Views: 414
what you think of this as a potential traders entrance... had a 4 then a pullback to 30wma.. now if starts falling dsay below 350 with stop above 383?

It's an interesting one. The Oil & Gas Producers Sector is outperforming the market currently and has pulled back to support. PMO.L however, is under performing it's sector, but performing inline with the market - which is in a downtrend. On the daily the trendline support is around 345 and on the weekly there's a rising trendline at 320, so I'm not sure I'd personally take it as the risk reward ratio is only about 1:1 for a short term play unless you bring you stop in tighter above the daily 30 week MA around 365.

So it's a weak stock, in a strong sector, in a weak market. So I think the method would say pass, as the key is to only try and pick the A+ winners and avoid the mediocre ones. It might go down, but if you are using the method you'd want a weak stock, in a weak sector, in a weak market for shorting candidates I think.
 

Attachments

  • PMO_weekly_25_11_11.png
    PMO_weekly_25_11_11.png
    119.5 KB · Views: 499
  • PMO_RS_weekly_25_11_11.png
    PMO_RS_weekly_25_11_11.png
    116.8 KB · Views: 443
  • oil_gas_prod_weekly_25_11_11.png
    oil_gas_prod_weekly_25_11_11.png
    119.4 KB · Views: 392
not sure if it interests you, but have gone through about the top1000 uk shares this afternoon, and these are the ones i found interesting..

long aey aht aie arm avon bkg car cct cpp dia fenr ged hyr inppipr itm jlf pay phnx prv pure qq ror weir wtm.

short aal abc afr ashm bba bee blnd blt boy bram brby brwm bvic cbg ccc chw clln cne cpp cscg csrt dcg dia dtc dvo efm enq fcs fdsa fgp fum gpor gss has hfd hl hlma hmso hoc hri iem ihg imi inf ipf itrk jdw jmf kaz kmr lad land lse lsp mgcr mjw mks mpi mrc mul nex nii oml pmo rsl rsw safe sdl sgro shb sks smdr smin srp sthr stob sxs tem tmpl tpk utg vct wpp xar...

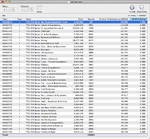
What you need to do to filter them further is sort the sectors by relative strength. Attached is the list as of 25/11 sorted by strongest sector at the top to weakest at the bottom since the October low.
 

Attachments

  • Sector_RS_25_11_11.png
    Sector_RS_25_11_11.png
    55.7 KB · Views: 463
wat you think to ppc? on weekly broke out stage 1?, then pulled back, now looking to go off again.
only thing is breakout volume was low?

Poor relative strength, a lot of resistance to work through and no 2x the 4 week average volume increase on the breakout. I'd say it's now in Stage 1B. It might go higher, but it doesn't meet the methods requirements.

do you find uk volume on breakouts work? i must admit in all years i traded ive ignored it as there not a lot of it in general unlike usa shares

US stocks are easier to see the volume changes on the straight volume chart like your previous good example, but I think it still works on UK stocks, but because of the thinner volumes I use cumulative force index to decipher it, by looking for a build in volume above it's moving average and positive divergence.
 
I noticed both of your picks are stocks that have fallen hard like the market has and so have resistance to fight through still. A big component of the method relative performance versus the market. You want to buy strength and sell weakness, so I'll give you an example of one of my current trades to illustrate this. The market trend was down when I bought this, so it breaks the rules a bit, but I think it's a good example of a good relative strength stock breaking out and currently retesting the breakout level. It might fail because the market is still negative, but has potential to move higher because of the size of the base and lack of resistance above it.

must admit as a rule i do prefer the rolls royce type chart to the aml, atk eg i gave you..
 
i not doing too well so far......lol

I think you're picking it up quite quickly. I've been working on my understanding of it for nearly a year now and I still keep making mistakes. I also need to sort myself out a check list to look at and am planning on rereading the book again this month as the shorting section seems particularly important to understand at the moment.
 
just re read thread again.. i see you look at about 1000 shares. do you look through each chart daily or have a system for narrowing everything down.
unfortunately the software i use doesnt have usa sectors so will have to think that through as def think as far as increase in volume is concerened usa shares are a lot better...
 
just re read thread again.. i see you look at about 1000 shares. do you look through each chart daily or have a system for narrowing everything down.
unfortunately the software i use doesn't have usa sectors so will have to think that through as def think as far as increase in volume is concerned usa shares are a lot better...

As the method is based on weekly charts, you get a fair amount of time to go through the charts as it can take months for setup to develop. A simple manual scan with the weinstein chart setup and you can see charts of interest fairly quickly. You'll be able to do it after a while of using the charts.

I'm also a huge fan of point and figure charts, and stockcharts.com has the best P&F charts and a great stock scan filter here: Stock Scan: Predefined Scans - Charting Tools - StockCharts.com which you can easily find stocks of interest.

I only tend to trade 6-10 stocks at the same time, so I don't have to look at everything everyday. But I try to focus on the major indexes, futures, currencies and commodities everyday, as the indexes and sectors make up around 70 to 80% of individual stocks moves each day.

Focus on relative performance if you are using scanning software to filter the market. A simple scan would be stocks outperforming the market and above their 30 week MA, plus a rising 30 week MA. You can filter that further by organizing the sectors by strength, the stock performance vs the sector, and then versus other candidates. You should then get a fairly small list to look at.
 
Back
Top