Stan Weinstein's Stage Analysis

Re: EURAUD Stage Analysis

I been focusing on finding some long term trades that have less correlation to the market moves, and currencies seem to be a good option for this. Attached is the monthly, weekly and daily charts for the EUR/AUD forex pair....
I read this thread with interest, so thanks to you both for keeping it going. For your relative strength component, you chart strength relative to the GSPC, but, as the relevant market is the currency market, would it be better, for example, to look at only the $ pairs and chart them against for example either the DXY (or the inverse of the DXY) or gold?
 
Re: EURAUD Stage Analysis

I read this thread with interest, so thanks to you both for keeping it going. For your relative strength component, you chart strength relative to the GSPC, but, as the relevant market is the currency market, would it be better, for example, to look at only the $ pairs and chart them against for example either the DXY (or the inverse of the DXY) or gold?

You can use any measure you want for relative performance really. The method is based around stocks, so the S&P 500 is the key metric for that. But for commodities you might compare against the CRB index or the CCI index, and for currencies like you say the DXY could be used. It all depends on what you are aiming to outperform, but the S&P 500 is used for the base comparison generally.
 
isa - if you have time would you be able to do me a daily chart with how you see the shorter term stage analysis for a year. i understand if no time.
 
This is my first attempt at making a video, so I've done a quick stage analysis of Gold.

To watch it click on the following link to the video:

http://www.screencast.com/t/GvBOOcPy3

or you can click on the larger image below.

I hope it's clear and makes sense? But hopefully I'll get better once I do a few more. :whistling


Attachments

  • GC_thumb_1_12_11.png
    GC_thumb_1_12_11.png
    104.2 KB · Views: 1,379
Last edited:
Thanks for your reply on currency, isa.
Thanks for video too - tech always takes more time and effort than you expect!
I study gold just simply on the basis of what I leant from the book and from Alan Saunders, who has studied Weinstein for years. ShareHunter
Weekly I think gold is going sideways, a bit like the stockmarket. http://stockcharts.com/h-sc/ui?s=$GOLD&p=W&yr=3&mn=0&dy=0&id=p91201552877
As I understand it, if you rode the stage 2, then you hold till the break down of stage 3, which would be 1612 or 1535, according to how you view emotional tails. You are holding in the possibility of a continuation up, i.e. on a break of 1900 or 1923, according to how you view emotional wicks.
Daily it looks even less clear, so I can't see the Weinstein interpretation except to leave it alone. Shorter-term traders would be looking at the triangle, and it could go either way. http://stockcharts.com/h-sc/ui?s=$GOLD&p=D&yr=0&mn=6&dy=0&id=p79751426216
What I would "expect", though I would not put money on it until the moves have started, is a break down move out of the triangle on the daily and then an up move on the weekly.
 
nice video. if you could reduce size a bit would be better..the force index wasnt shown. nor half of daily chart.

if you were to do stage analysis and trade off daily charts(i accept you dont), but what period moving average would you use
 
nice video. if you could reduce size a bit would be better..the force index wasnt shown. nor half of daily chart.

if you were to do stage analysis and trade off daily charts(i accept you dont), but what period moving average would you use

I thought that might happen as I'm on a 27" screen. You should be able to use the vertical and horizontal scroll bars in your browser to move around though. I might have to make some mini sized versions of my charts to fit on a more standard screen size setting, plus it'd make the file size of the video a bit smaller too.

I like to keep the charts pure to the method whatever timescale it's on. So I always use the 30 bar weighted MA on all charts, as that's how I can best see the stages personally. I use it just the same on 15 minute charts as on the weekly. So when I'm trying to enter a position I go down to the intra-day charts, 15min, 30min, 1hr, 4hr etc and try to make sure they all look ok.

If you are going to solely use the daily though I think it's important to add the 30 week MA to your daily chart, as the weekly stages are most important. For example you might be looking good on the daily, but running in to the falling 30 week MA and not knowing. So you want to add 150 day weighted MA as a proxy for the 30 week MA (i.e. 5 days x 30 week weighted MA = 150 days) to see where you are likely to get some major resistance.
 
just played it again, and it works this time...i was aving a senior mo....soz...

your force index is it a variation of elders force, as mine looks diff.
 
just played it again, and it works this time...i was aving a senior mo....soz...

your force index is it a variation of elders force, as mine looks diff.

It's the same as Elder's Force, but I've found it works better for me using a cumulative setting of 10 days. As in it's basic form that Elder uses it's all about looking for divergences to catch reversals. Whereas I think my variation is more useful for actually reading total volume coming or going into a stock. You should be able to create it fairly easily if you want to use it yourself. Does your Sharescope software let you do custom code?
 
with force index it is indicator someone else has written which imported, but has no user inputs..i will contact them and see if they will write a script, as i do like the look of yours...i am substituting it for on bal vol, but doesnt look as good.
 
would you agree with my daily stage analysis for the ftse, for shorter term trading periods?
 

Attachments

  • ftse6.png
    ftse6.png
    31.6 KB · Views: 433
would you agree with my daily stage analysis for the ftse, for shorter term trading periods?

No, we haven't had a stage 2 on the daily chart for a long time on the FTSE. I've done a quick marked up chart with coloured zones. Don't take it as gospel as I've done it quickly, so the changeover points to the different stages might be a bit out. But hopefully it's not too far out.
 

Attachments

  • FTSE_daily_2_12_11.png
    FTSE_daily_2_12_11.png
    64.4 KB · Views: 480
Here's another video theblackmamba. Can you let me know if size is any better on the width? Here's the link:

Gold_GC_2011-12-03_1504 - isatrader's library

I think I might reorder the chart for the video, so that relative performance is at the top, then force index, then volume, then the straight performance at the bottom as I imagine I'll be referencing the first two more, so will save the scrolling up and down if you have a small screen.

See if this fits better: http://screencast.com/t/xnRWOuHRp3
 
Last edited:
the width is perfect on that one. have to scroll down to see some of the indicators, but thats ok..

Thanks, I've now reordered it and dropped the performance indicator as isn't needed on the video one, so it should just be the straight volume indicator that won't be visible without scrolling.
 
Here's a video using the weekly charts only with the results from my US stock scan.

I used filters of stocks outperforming the S&P 500 since the October low, that had a rising 30 moving average and had positive Mansfield relative strength. I then filtered it down manually to only the best ones that I could see, but I think SE and GPC look the best of the bunch personally. Although I biased on SE as I'm already in that. But see if you agree.

Here's my video: 2011-12-03 - US stocks watchlist

It was stopped short because it only allows 5 minutes so UNP isn't shown.

The analysis needs to go further though as it's important to look at relative performance of the sectors vs the market of the stocks and also of the relative performance of the stocks vs the sectors. Plus different time frames and the market stage itself. But I think the scan was a good way of filtering out the vast majority of stocks and so gives me less charts to go through manually.
 
Last edited:
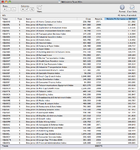
I did the scan on the 161 US sectors and had 41 hits. I ordered them with the best relative performance vs the S&P 500 at the top. So I believe according to the method that I'd want to be focusing on the top performing sectors for longs if we manage to break out into a new Stage 2 anytime soon.

attachment.php
 

Attachments

  • US_Sectors_scan_2_12_11.png
    US_Sectors_scan_2_12_11.png
    59.5 KB · Views: 1,561
Last edited:
Back
Top