Stan Weinstein's Stage Analysis

Stage 1A - examples

As a follow up to my previous post outlining the break down of the four stages, I've been going through the Global Trend Alert Newsletter to get some real life examples of the various stages to use as a reference in the future.

Stage 1A - Start of a base. Needs much more time

Key
(+) Outstanding pattern in that Stage.
(–) Unexciting pattern in that Stage.
 

Attachments

  • AGN_2-25-05.png
    AGN_2-25-05.png
    58.7 KB · Views: 1,630
  • AVY_2-25-05.png
    AVY_2-25-05.png
    61.2 KB · Views: 1,443
  • BRCM_2-25-05.png
    BRCM_2-25-05.png
    55.6 KB · Views: 1,252
  • CCE_2-25-05.png
    CCE_2-25-05.png
    56.5 KB · Views: 1,063
  • JBL_2-25-05.png
    JBL_2-25-05.png
    59.4 KB · Views: 1,061
  • TER_2-25-05.png
    TER_2-25-05.png
    59.5 KB · Views: 957
  • PGN_2-25-05.png
    PGN_2-25-05.png
    64.4 KB · Views: 959
  • MXIM_2-25-05.png
    MXIM_2-25-05.png
    62.3 KB · Views: 1,013
  • KSS_2-25-05.png
    KSS_2-25-05.png
    62.1 KB · Views: 966
  • KO_2-25-05.png
    KO_2-25-05.png
    59.4 KB · Views: 1,026
  • THC_2-25-05.png
    THC_2-25-05.png
    54.6 KB · Views: 976
  • TIF_2-25-05.png
    TIF_2-25-05.png
    56.1 KB · Views: 939
  • XLNX_2-25-05.png
    XLNX_2-25-05.png
    60.3 KB · Views: 1,054
Stage 1 - examples

Stage 1 - Basing Phase. May begin accumulation.

Key
(+) Outstanding pattern in that Stage.
(–) Unexciting pattern in that Stage.
 

Attachments

  • HPQ_2-25-05.png
    HPQ_2-25-05.png
    60.6 KB · Views: 889
  • BMY_2-25-05.png
    BMY_2-25-05.png
    60.4 KB · Views: 1,044
  • AMAT_2-25-05.png
    AMAT_2-25-05.png
    57.4 KB · Views: 960
  • ABC_2-25-05.png
    ABC_2-25-05.png
    59.3 KB · Views: 977
  • A_2-25-05.png
    A_2-25-05.png
    55 KB · Views: 1,047
  • IPG_2-25-05.png
    IPG_2-25-05.png
    56.4 KB · Views: 881
  • LSI_2-25-05.png
    LSI_2-25-05.png
    58.7 KB · Views: 888
  • WPI_2-25-05.png
    WPI_2-25-05.png
    58 KB · Views: 1,145
Stage 1B - examples

Stage 1B - Late in base-building phase. Watch for breakout.

Key
(+) Outstanding pattern in that Stage.
(–) Unexciting pattern in that Stage.
 

Attachments

  • NVLS_2-25-05.png
    NVLS_2-25-05.png
    61.1 KB · Views: 902
  • KLAC_2-25-05.png
    KLAC_2-25-05.png
    61.6 KB · Views: 983
  • INTC_2-25-05.png
    INTC_2-25-05.png
    57.1 KB · Views: 950
  • CAH_2-25-05.png
    CAH_2-25-05.png
    55.4 KB · Views: 963
Stage 2A - examples

Stage 2A - Early in uptrend stage. Ideal time to buy aggressively.

Key
(+) Outstanding pattern in that Stage.
(–) Unexciting pattern in that Stage.
 

Attachments

  • TXN_2-25-05.png
    TXN_2-25-05.png
    59.9 KB · Views: 1,017
  • KR_2-25-05.png
    KR_2-25-05.png
    61.1 KB · Views: 1,128
Stage 2 - examples

Stage 2 - Advancing Stage

Key
(+) Outstanding pattern in that Stage.
(–) Unexciting pattern in that Stage.
 

Attachments

  • ABT_2-25-05.png
    ABT_2-25-05.png
    62.8 KB · Views: 997
  • AZO_2-25-05.png
    AZO_2-25-05.png
    57.1 KB · Views: 869
  • BAX_2-25-05.png
    BAX_2-25-05.png
    55.1 KB · Views: 897
  • CPWR_2-25-05.png
    CPWR_2-25-05.png
    61.1 KB · Views: 881
  • EMC_2-25-05.png
    EMC_2-25-05.png
    59.7 KB · Views: 748
  • NSM_2-25-05.png
    NSM_2-25-05.png
    55.2 KB · Views: 937
Stage 2B - examples

Stage 2B - Getting late in uptrend. Watch carefully. But still a hold.

Key
(+) Outstanding pattern in that Stage.
(–) Unexciting pattern in that Stage.
 

Attachments

  • APC_2-25-05.png
    APC_2-25-05.png
    53.9 KB · Views: 745
  • APA_2-25-05.png
    APA_2-25-05.png
    52 KB · Views: 886
  • AES_2-25-05.png
    AES_2-25-05.png
    50.6 KB · Views: 778
  • ADSK_2-25-05.png
    ADSK_2-25-05.png
    48.6 KB · Views: 841
  • AAPL_2-25-05.png
    AAPL_2-25-05.png
    47.8 KB · Views: 934
  • MO_2-25-05.png
    MO_2-25-05.png
    54.9 KB · Views: 752
  • CSX_2-25-05.png
    CSX_2-25-05.png
    58.1 KB · Views: 731
  • AXP_2-25-05.png
    AXP_2-25-05.png
    54.7 KB · Views: 725
  • ATI_2-25-05.png
    ATI_2-25-05.png
    51.7 KB · Views: 860
Stage 3A - examples

Stage 3A - Looks as if a top is starting to form. Be sure to protect holdings with a close stop.

Key
(+) Outstanding pattern in that Stage.
(–) Unexciting pattern in that Stage.
 

Attachments

  • ED_2-25-05.png
    ED_2-25-05.png
    62.9 KB · Views: 773
  • DHR_2-25-05.png
    DHR_2-25-05.png
    52 KB · Views: 845
  • CTXS_2-25-05.png
    CTXS_2-25-05.png
    60 KB · Views: 817
  • CCL_2-25-05.png
    CCL_2-25-05.png
    50.3 KB · Views: 793
  • AMD_2-25-05.png
    AMD_2-25-05.png
    55.4 KB · Views: 804
  • FISV_2-25-05.png
    FISV_2-25-05.png
    63.4 KB · Views: 793
  • GPS_2-25-05.png
    GPS_2-25-05.png
    58.7 KB · Views: 798
  • KEY_2-25-05.png
    KEY_2-25-05.png
    56.5 KB · Views: 819
Stage 3 - examples

Stage 3 - The Top Area. Start to reduce positions.

Key
(+) Outstanding pattern in that Stage.
(–) Unexciting pattern in that Stage.
 

Attachments

  • GAS_2-25-05.png
    GAS_2-25-05.png
    56.4 KB · Views: 780
  • FII_2-25-05.png
    FII_2-25-05.png
    62.4 KB · Views: 770
  • CMI_2-25-05.png
    CMI_2-25-05.png
    52.4 KB · Views: 790
  • AEP_2-25-05.png
    AEP_2-25-05.png
    55.6 KB · Views: 837
  • AA_2-25-05.png
    AA_2-25-05.png
    56.5 KB · Views: 832
  • UPS_2-25-05.png
    UPS_2-25-05.png
    53.8 KB · Views: 766
  • PH_2-25-05.png
    PH_2-25-05.png
    54.1 KB · Views: 837
  • PGR_2-25-05.png
    PGR_2-25-05.png
    55.8 KB · Views: 815
  • PG_2-25-05.png
    PG_2-25-05.png
    55.5 KB · Views: 823
  • MI_2-25-05.png
    MI_2-25-05.png
    52.4 KB · Views: 822
Stage 3B - examples

Stage 3B - Has become increasingly toppy. Use rallies for at least partial selling.

Key
(+) Outstanding pattern in that Stage.
(–) Unexciting pattern in that Stage.
 

Attachments

  • ADP_2-25-05.png
    ADP_2-25-05.png
    58.5 KB · Views: 738
  • BK_2-25-05.png
    BK_2-25-05.png
    57.8 KB · Views: 794
  • BSX_2-25-05.png
    BSX_2-25-05.png
    58.4 KB · Views: 771
  • CA_2-25-05.png
    CA_2-25-05.png
    55 KB · Views: 747
  • CMA_2-25-05.png
    CMA_2-25-05.png
    58 KB · Views: 784
  • JPM_2-25-05.png
    JPM_2-25-05.png
    52.1 KB · Views: 773
  • ITW_2-25-05.png
    ITW_2-25-05.png
    55 KB · Views: 668
  • DOV_2-25-05.png
    DOV_2-25-05.png
    56.4 KB · Views: 774
Stage 4A - examples

Stage 4A - Stock has entered Downtrend Stage. Close out remaining positions.

Key
(+) Outstanding pattern in that Stage.
(–) Unexciting pattern in that Stage.
 

Attachments

  • AFL_2-25-05.png
    AFL_2-25-05.png
    56.8 KB · Views: 846
  • APOL_2-25-05.png
    APOL_2-25-05.png
    56.2 KB · Views: 709
  • BBY_2-25-05.png
    BBY_2-25-05.png
    55.3 KB · Views: 787
  • R_2-25-05.png
    R_2-25-05.png
    52.1 KB · Views: 741
  • YHOO_2-25-05.png
    YHOO_2-25-05.png
    50.7 KB · Views: 874
Stage 4 - examples

Stage 4 - The Declining Stage. Avoid on the long side.

Key
(+) Outstanding pattern in that Stage.
(–) Unexciting pattern in that Stage.
 

Attachments

  • CSCO_2-25-05.png
    CSCO_2-25-05.png
    55.3 KB · Views: 672
  • CSC_2-25-05.png
    CSC_2-25-05.png
    55 KB · Views: 709
  • BMC_2-25-05.png
    BMC_2-25-05.png
    62.1 KB · Views: 726
  • BBBY_2-25-05.png
    BBBY_2-25-05.png
    62.4 KB · Views: 658
  • ALTR_2-25-05.png
    ALTR_2-25-05.png
    58.8 KB · Views: 717
  • MDP_2-25-05.png
    MDP_2-25-05.png
    56.1 KB · Views: 668
  • LXK_2-25-05.png
    LXK_2-25-05.png
    59.1 KB · Views: 664
  • IP_2-25-05.png
    IP_2-25-05.png
    62.7 KB · Views: 677
  • IGT_2-25-05.png
    IGT_2-25-05.png
    55 KB · Views: 658
  • HBAN_2-25-05.png
    HBAN_2-25-05.png
    58.3 KB · Views: 715
  • TLAB_2-25-05.png
    TLAB_2-25-05.png
    60.8 KB · Views: 646
Stage 4B - examples

Stage 4B - Late in downtrend. Much too soon to consider buying.

Key
(+) Outstanding pattern in that Stage.
(–) Unexciting pattern in that Stage.
 

Attachments

  • LLY_2-25-05.png
    LLY_2-25-05.png
    63.8 KB · Views: 721
  • JDSU_2-25-05.png
    JDSU_2-25-05.png
    57.3 KB · Views: 732
  • INTU_2-25-05.png
    INTU_2-25-05.png
    59.4 KB · Views: 632
  • FITB_2-25-05.png
    FITB_2-25-05.png
    60.8 KB · Views: 797
  • ADI_2-25-05.png
    ADI_2-25-05.png
    58.9 KB · Views: 679
  • NYT_2-25-05.png
    NYT_2-25-05.png
    55.1 KB · Views: 809
  • NWL_2-25-05.png
    NWL_2-25-05.png
    54.9 KB · Views: 669
  • MYL_2-25-05.png
    MYL_2-25-05.png
    54.3 KB · Views: 647
  • MRK_2-25-05.png
    MRK_2-25-05.png
    50.3 KB · Views: 606
Gold Analysis

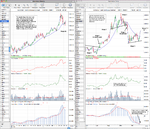
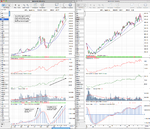
Gold looks to be in late Stage 2b on the weekly chart and is moving into Stage 1a on the daily chart after the breakout yesterday. See attached chart.
 

Attachments

  • GOLD_Stages_26_10_11.png
    GOLD_Stages_26_10_11.png
    121.9 KB · Views: 1,051
Hi isa,

in Stan's Global Trend Alert document, he performs a stage analysis on sectors. I am strugling for some time to find some symbols for each sector, so i can perform stage analysis as well. Do you happen to know a free resource on this? For example what is the symbol for Chemicals Diversified, so i can use it in bloomberg.com, or stockcharts.com to be able to see the chart on that particular group.

Thanks
 
Hi @vali83

In Stockcharts search box just search for the $ sign and all the US sectors are there. Here's the link
StockCharts.com - Free Charts - Symbol Search

Or for for UK 350 Sectors here's the list which you can get historical data from yahoo finance Yahoo! UK & Ireland Finance - FTSE, Stock Exchange, Mortgages, Loans & More
So for example just put ^NMX0530 into the search for Oil and Gas Producers etc:

^NMX0530 FTSE 350 Sector Oil & Gas Producers
^NMX0570 FTSE 350 Sector Oil Equipment Services &
^NMX1350 FTSE 350 Sector Chemicals
^NMX1730 FTSE 350 Sector Forestry & Paper
^NMX1750 FTSE 350 Sector Industrial Metals
^NMX1770 FTSE 350 Sector Mining
^NMX2350 FTSE 350 Sector Construction & Materials
^NMX2710 FTSE 350 Sector Aerospace & Defense
^NMX2720 FTSE 350 Sector General Industrials
^NMX2730 FTSE 350 Sector Electronic & Electrical Equipment
^NMX2750 FTSE 350 Sector Industrial Engineering
^NMX2770 FTSE 350 Sector Industrial Transportation
^NMX2790 FTSE 350 Sector Support Services
^NMX3350 FTSE 350 Sector Automobiles & Parts
^NMX3530 FTSE 350 Sector Beverages
^NMX3570 FTSE 350 Sector Food Producers
^NMX3720 FTSE 350 Sector Household Goods
^NMX3760 FTSE 350 Sector Personal Goods
^NMX3780 FTSE 350 Sector Tobacco
^NMX4530 FTSE 350 Sector Health Care Equipment & Services
^NMX4570 FTSE 350 Sector Pharmaceuticals & Biotechnology
^NMX5330 FTSE 350 Sector Food & Drug Retailers
^NMX5370 FTSE 350 Sector General Retailers
^NMX5550 FTSE 350 Sector Media
^NMX5750 FTSE 350 Sector Travel & Leisure
^NMX6530 FTSE 350 Sector Fixed Line Telecommunications
^NMX6570 FTSE 350 Sector Mobile Telecommunications
^NMX7530 FTSE 350 Sector Electricity
^NMX7570 FTSE 350 Sector Gas Water & Multiutilities
^NMX8350 FTSE 350 Sector Banks
^NMX8530 FTSE 350 Sector Nonlife Insurance
^NMX8570 FTSE 350 Sector Life Insurance
^NMX8670 FTSE 350 Sector Real Estate Investment Trusts
^NMX8770 FTSE 350 Sector Financial Services
^NMX8980 FTSE 350 Sector Equity Investment Instruments
^NMX9530 FTSE 350 Sector Software & Computer Services
^NMX9570 FTSE 350 Sector Technology Hardware & Equipment
 
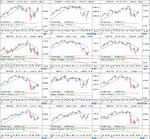
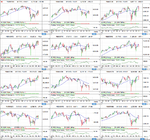
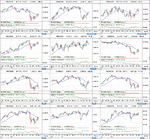
Here's a small view of the FTSE 350 sectors currently. The list of the charts names is in the previous post.
 

Attachments

  • FTSE350_Sectors_1.png
    FTSE350_Sectors_1.png
    90.7 KB · Views: 938
  • FTSE350_Sectors_2.png
    FTSE350_Sectors_2.png
    92.7 KB · Views: 965
  • FTSE350_Sectors_3.png
    FTSE350_Sectors_3.png
    89.9 KB · Views: 801
FTSE 350 Sector Relative Performance

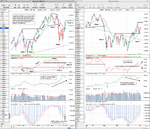
Attached is a screenshot of the FTSE 350 Sectors Relative Performance versus the S&P 500. So you can see which are the strongest and weakest sectors since the October low.
 

Attachments

  • FTSE350_Sectors_RS_vs_SP500.png
    FTSE350_Sectors_RS_vs_SP500.png
    87.2 KB · Views: 968
Here's my updated S&P 500 stage analysis. I think we are in Stage 1A currently, so still a short term traders market at the moment IMO.
 

Attachments

  • SPX_Stages_4_11_11.png
    SPX_Stages_4_11_11.png
    139.2 KB · Views: 1,155
US Treasuries Stage Analysis

I like to keep an eye on the Treasuries charts as they have a good inverse relationship with the stock market. So I've updated my stage analysis of the US 30 year Treasuries and included the 10 year US Treasuries charts as well.

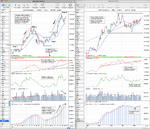
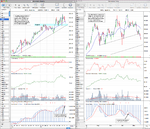
On the US 30 Year Treasuries weekly chart, price pulled back to the 30 week MA four weeks ago and has had a good bounce since. However, it is yet to make a new high, volume has been below average and relative performance vs the S&P 500 is weakening, so I'm considering it in late Stage 2B at the moment as the moving average is still trending higher.

On the daily chart it is much weaker and has moved into Stage 3 with price trying to break back above the trendline, but so far failing. It's in a Stage 3 range so it could go either way with a break above 147 or break below 135. However, if it fails to make a new high soon then I'd favour it managing to break below 135.

The US 10 Year Treasuries are showing the same pattern so I'd be looking for a break below 127 if it can't make a new high soon.
 

Attachments

  • US-30-Year-Treasuries_18_11_11.png
    US-30-Year-Treasuries_18_11_11.png
    128 KB · Views: 770
  • US-10-Year-Treasuries_18_11_11.png
    US-10-Year-Treasuries_18_11_11.png
    123.8 KB · Views: 740
Apple (AAPL) Stage Analysis

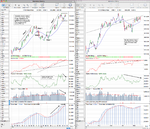
Personally I think AAPL looks very interesting currently, as it looks like it wants to test the long term trendline - which is currently around the 355 area. But it is also just above an area of strong support which could limit the current down move.

The monthly chart shows the steady volume going into AAPL over the last two years. Which is not the same as the parabolic move in 2007 imo. So this current top isn't a blow off top like that was, as the volume has grown steadily over the last two years - so there is a lot less speculative money which I think is a good sign.

Below are my charts
 

Attachments

  • AAPL_Monthly_21_11_11.png
    AAPL_Monthly_21_11_11.png
    119.6 KB · Views: 778
  • AAPL_Daily_21_11_11.png
    AAPL_Daily_21_11_11.png
    124.9 KB · Views: 761
Top