Solid ECN | Professional Market Analysis | *Video*

United States of America
USD is strengthening against JPY and has ambiguous dynamics against GBP and EUR.

There are no significant economic releases planned in the US today, but this week, American investors are waiting for the publication of a series of data from the labor market. This statistic is especially important as it is the second key factor after inflation to raise rates by the US Federal Reserve. Tomorrow, the December JOLTS job openings data will be released, on Wednesday, the December ADP employment data will be published, and on Friday, the federal employment and unemployment data will be published. Administration officials raised concerns as early as last week that the ongoing Omicron coronavirus epidemic could skew the latest employment statistics in the country, which has forced millions of citizens to leave work due to illness or to care for family members. Still, in general, they believe the crisis is short-term and remain optimistic. Yesterday, the head of the Fed of Atlanta, Rafael Bostic, in an interview with the Financial Times, said that the regulator did not rule out raising interest rates immediately by 0.50% instead of the usual 0.25% if inflation in the country remains at a high level.​


Eurozone
EUR is strengthening against JPY and has ambiguous dynamics against GBP and USD.

Investors are focused on today's publication of preliminary data on the GDP of the Eurozone countries for the fourth quarter of last year. The European economy slowed growth from 2.2% to 0.3% QoQ and accelerated from 3.9% to 4.6% YoY, which is slightly less than forecasts of 4.7%. Experts note that the negative dynamics are associated with the coronavirus epidemic, which began to put pressure on it at the end of last year. The service sector, and especially the tourism sector, suffered the most. The German economy shrank by 0.7% due to quarantine restrictions imposed on unvaccinated citizens. However, this fall was offset by the growth of the French economy by 0.7% and the Spanish by 2.0%, which made the economy of this country the fastest growing one in the Eurozone. Today, preliminary January data on inflation in Germany were released. The consumer price index remained at the same level of 4.9% YoY instead of the expected decline to 4.3% and remained around 0.4% MoM instead of falling to 0.3%.​


United Kingdom
GBP is strengthening against JPY and has ambiguous dynamics against EUR and USD.

There are no significant economic releases planned in the UK today, so investors continue to monitor the crisis around Prime Minister Boris Johnson and prepare for the Bank of England meeting. On Monday, the publication of materials from an internal government investigation, which is being carried out by high-ranking official Sue Gray, may take place. They can force Johnson to resign. The investigation details are not yet known, but the media reports that between May 2020 and April 2021, at least 15 meetings at the prime minister's residence or other government offices that violated quarantine rules were held. The first meeting of the Bank of England this year is to be held on Thursday, and observers do not rule out a new rate hike to 0.50% to combat rising inflation in the country. Likely, the outbreak of the Omicron epidemic in the UK will not affect the resolve officials to tighten monetary policy since the epidemiological crisis is considered temporary, and its consequences are less dangerous than from a prolonged increase in prices.​


Japan
JPY is weakening against its main competitors – EUR, GBP, and USD.

Published today, the December data on industrial production and retail sales in Japan were poor. Output fell by 1.0% after rising by 7.0% for November. A decrease in production equipment output exerted pressure on the indicator. Retail sales slowed growth from 1.9% to 1.4% instead of accelerating to 2.7%. In January, the Japanese household confidence index fell for the second month in a row, this time from 39.1 to 36.7 points. The rapid spread of the Omicron epidemic has dampened consumer sentiment.​


Australia
AUD is strengthening against its main competitors – USD, EUR, GBP, and JPY.

AUD is rising ahead of the first meeting of the Reserve Bank of Australia this year, which will be held on Tuesday. Investors expect the regulator to end its emergency bond-buying program and announce the start of rate hikes as domestic inflation continues to rise strongly and unemployment remains low. Previously, it was assumed that officials would begin the rate hike cycle no earlier than 2023, but now experts believe that the first correction could happen in the fall, but several experts predict an increase as early as May or June.​


Oil
Oil quotes are moderately weakening.

The current decline in prices is seen as technical, as the long-term growth factors of the oil market remain. First of all, it is supported by the geopolitical risks of a conflict on the border with Ukraine and an aggravation of the situation in the Middle East, where the infrastructure of the world's leading oil exporters Saudi Arabia and the United Arab Emirates, continues to be under the threat of attacks from the Yemeni Houthi rebels. Investors also expect the next meeting of representatives of the countries participating in the OPEC+ agreement. They should decide whether to continue with the current tactics and increase the amount of oil brought to the market every month by 400K barrels per day.​
 
Nasdaq 100: positive reporting supports the stock market

Current trend

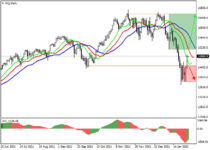
The quotes of the US tech index are being actively corrected within an uptrend after the publication of positive reports last week and in anticipation of today's data from the tech sector. The Nasdaq 100 is currently trading at 14880.0.

The most attention of market participants is riveted to the report of Alphabet Inc., where analysts expect the company to grow quarterly revenue to a record $72.19B, while oil industry leader Exxon Mobil Corp. revenue could reach a historic $85.01B with earnings per share of $1.93. According to preliminary estimates of experts, payment holding company PayPal Holdings Inc. and automobile corporation General Motors Co. will turn out to be positive, too. If the growth of the quarterly revenue of the first is an anticipated event, then the possible return of the indicators of the second to pre-crisis levels of $35.2B may significantly affect the dynamics of trading.

The growth leaders in the index are Pinduoduo Inc. (+12.80%), Netflix Inc. (+11.13%), Tesla Inc. (+10.68%), and Baidu Inc. (+9.02%).

The decline leaders are Regeneron Pharmaceutical Inc. (–2.61%), Walgreens Boots Alliance Inc. (–1.39%), Amgen Inc. (–0.87%), and PACCAR Inc. (–0.72%).

Support and resistance
The price corrects against the global trend, rising within the local wave. Technical indicators are in a state of a rapidly weakening sell signal: indicator Alligator's EMA fluctuations range began to narrow, and the histogram of the AO oscillator, trading in the sell zone, formed several upward bars.

Resistance levels: 15160.0, 16600.0.
Support levels: 14488.0, 13830.0.

nasdaq.png
 
AUDUSD Market Forecast
RBA decision pushed quotes up

Current trend
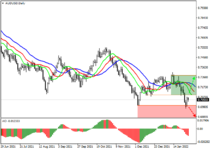
The Australian currency shows stability against its main competitors, despite the decline against the US dollar last week. At the moment, AUDUSD is correcting upwards and is trading at around 0.7055 amid the decision of the Reserve Bank of Australia on a planned monetary policy adjustment.

The main interest rate was left at 0.10%, but the quantitative easing (QE) program will be completely terminated, and the last asset purchase under it is scheduled for February 10. Thus, the Australian regulator decided to follow the example of world financial regulators, despite the fact that the situation in the domestic economy is much better than in other countries. The updated forecast puts Australia's GDP growth at 4.25% over 2022 and inflation below 3.5%, even with high fuel prices and continued disruptions to supply chains.

The current trading week for the US currency began with a correction, which may intensify after the release of data on JOLTS Job Openings from the US Bureau of Labor Statistics. If the figures coincide with the analysts' forecast, which suggests a reduction to 10.300M from 10.552M a month earlier, this may have a negative impact on the dollar. In addition, traders should pay attention to Manufacturing PMI, which, according to forecasts, may decline from 58.7 to 57.5 points.

Support and resistance
On the global chart of the asset, the price is being traded within the downtrend. Technical indicators are in a sell signal state: fast EMAs on the Alligator indicator are below the signal line, and the AO oscillator histogram is trading in the sell zone.

Support levels: 0.6993, 0.6850.
Resistance levels: 0.7096, 0.7290.

audusd.png
 
Tesla Inc
Fourth-quarter results beat market expectations


The shares of Tesla Inc. are strengthening from the 3-month low of January 28, adding more than 18%. From a November 52-week high, the issuer fell by 24.5% but rose by 0.72% over the past week, while the S&P 500 index rose by 2.37%.

Last week, Q4 2021 earnings per share were released with earnings per share of $2.54, almost double last year's figure and well above the Wall Street experts' forecast of $2.34. Revenue rose by 65% YoY to $17.72B, also beating the market's forecast of $16.57B. In the current 2022, the corporation expects a 50% increase in revenue compared to 2021 to $75B, even if only the Freemont and Shanghai gigafactories work at full capacity (the planned production level is 3K electric vehicles per week).

Analysts at Swiss financial conglomerate Credit Suisse Group AG have upgraded Tesla Inc. from Neutral to Outperforming with an unchanged target price of $1,025. In a research note, the experts noted that the instrument has an attractive entry point after the recent sell-off.

Support and resistance
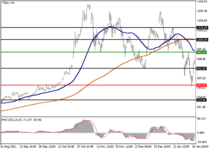
As part of the correction, the instrument renewed local lows and is consolidating. The key range is the area of 800.00–980.00. There is potential for further decline. Indicators reflect the strength of sellers: the price consolidated below MA (50) and MA (200); MACD histogram is in the negative zone. It is better to open the positions from the key levels.

Comparative analysis of the company's multipliers and companies-competitors in the industry indicates that the asset is overpriced.

Resistance levels: 980, 1050, 1115.
Support levels: 892, 800, 720.​

tesla.png
 
NZDUSD
Fixing long positions is a catalyst for price correction

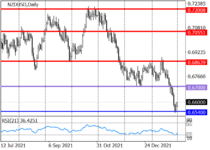
After reaching the main selling target in the area of 0.6540, NZDUSD is reversing into a correction with the target of 0.67 against the background of the weakening of the US dollar, which is falling from the high of 97.430 in the USD Index, reached last Friday, to the levels of 96.500-96.300 today. The negative trend is due to weak macroeconomic statistics published in the US on January 28.

Due to the difference in the monetary policy of the Reserve Bank of New Zealand and the US Federal Reserve, NZDUSD is likely to fall again with the target of 0.6400 after the correction.

Support and resistance
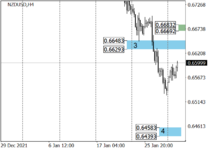
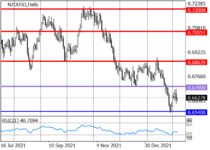
The long-term trend in NZD/USD is downward. Now a correction is being developed with the target of 0.6700, after reaching which it is worth considering new sales of the asset with the target at 0.6540, and in the case of breaking it down, the movement will continue to 0.6400. Traders should pay attention to the readings of the RSI indicator, which has generated a Divergence signal, which is a reversal pattern that suggests the development of a correction to a downtrend.

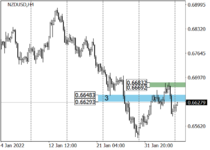
The mid-term trend is downward. Last week, traders broke through the target zone 3 (0.6648–0.6629). The next sell target is target zone 4 (0.6458–0.6439).

Resistance levels: 0.6700, 0.6864, 0.7055.
Support levels: 0.6540, 0.6400.​

nzdusd_1.pngnzdusd_2.png
 
USDCAD, Elliot Wave Analysis by Solid ECN Securities

The pair may grow.

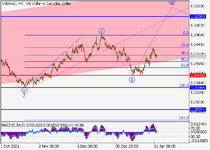
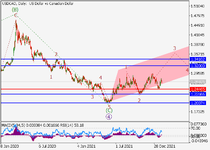
On the daily chart, a downward correction developed as the wave of the higher level 4, and the development of the fifth wave 5 started, within which the wave (1) of 5 forms. Now, the third wave of the lower level 3 of (1) is developing, within which the wave i of 3 has formed, a local correction has ended as the wave ii of 3, and the wave iii of 3 is developing. If the assumption is correct, the pair will grow to the levels of 1.3200–1.3410. In this scenario, critical stop loss level is 1.2446.​

usdcad_1.pngusdcad_2.png
 
EURUSD
The euro develops a corrective impetus

Current trend

The instrument is moderately supported by the growing interest of investors in risky assets against the backdrop of discussions on the prospects for tightening monetary policy by the US Fed. At the moment, it is not clear whether the US regulator will decide on five or even more interest rate hikes this year, and whether the figure will be adjusted immediately by 50 basis points.

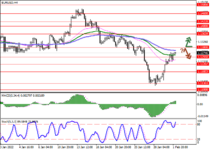
Bollinger Bands on the daily chart show a steady decline. The price range is narrowing, reflecting the emergence of multidirectional trading dynamics in the short term. MACD grows, preserving a stable buy signal (located above the signal line). Stochastic shows an upward direction but is rapidly approaching its highs, which reflects the risks of overbought EUR in the ultra-short term.

Resistance levels: 1.1300, 1.1363, 1.1400, 1.1422.
Support levels: 1.1255, 1.1220, 1.1185, 1.1130.

eurusd_1.pngeurusd_2.png
 
EUR/USD
The European currency shows weak growth against the US dollar during the Asian session, developing the corrective momentum formed at the beginning of the week and updating the local highs from January 26. The instrument is moderately supported by the growing interest of investors in risky assets against the backdrop of discussions on the prospects for tightening monetary policy by the US Fed. At the moment, it is not clear whether the US regulator will decide on five or even more interest rate hikes this year, and whether the figure will be adjusted immediately by 50 basis points. The European Central Bank (ECB), in turn, relieved the markets of unnecessary expectations in advance, declaring its readiness to adjust existing parameters, focusing on the epidemiological situation caused by the spread of COVID-19, which is putting significant pressure on the region's economy. Macroeconomic statistics from Europe published on Tuesday turned out to be moderately optimistic. Investors reacted rather positively to the decline in the Unemployment Rate in Germany from 5.2% to 5.1%, while the Unemployment Change fell by 48K in January after a decrease of 29K a month earlier (expert forecasts assumed a change of only 6K).

GBP/USD
The British pound is trading with multidirectional dynamics against the US currency during the morning session, consolidating after a two-day rally, which brought the instrument to local highs on January 24. Significant support for the pound yesterday was provided by optimistic macroeconomic publications from the UK. Markit Manufacturing PMI in January rose from 56.9 to 57.3 points, while analysts did not expect any changes. Mortgage Approvals in December increased from 67.859K to 71.015K, which also turned out to be stronger than forecasts at the level of 66K. At the same time, Consumer Credit in December still slightly decreased from 0.999B to 0.831B pounds. Analysts had expected a decline to 0.80B pounds.

AUD/USD
The Australian dollar shows mixed trading dynamics against the US dollar during the Asian session. The instrument is consolidating near 0.7130 and is holding near the local highs of January 26. The development of "bullish" sentiment, in addition to the widespread weakening of the US currency across the spectrum of the market, was facilitated by the minutes of the meeting of the Reserve Bank of Australia (RBA) published yesterday. As expected, the Australian regulator left the interest rate unchanged at 0.10%, but at the same time announced the complete end of the quantitative easing (QE) program on February 10, which, however, does not mean the automatic launch of a rate increase cycle, since the regulator will continue to monitor the situation closely and respond accordingly. The overall positive picture was slightly spoiled only by the data on Retail Sales in Australia. In December, sales volumes fell by 4.4% after rising by 7.3% in November. Analysts expected a positive trend to remain at the level of 3.9%.

USD/JPY
The US dollar is showing a slight corrective growth against the Japanese yen in Asian trading, testing 114.80 for a breakout. The appearance of corrective dynamics is associated with the development of technical factors, while the fundamental background changes little. The macroeconomic statistics from the US published yesterday were ambiguous. ISM Manufacturing PMI in January fell from 58.8 to 57.6 points, which was better than market expectations by only 0.1 points. At the same time, ISM Manufacturing New Orders Index for the same period fell from 61 to 57.9 points with neutral investor forecasts. Markit Manufacturing PMI in January rose from 55 to 55.5 points, also ahead of analysts' neutral forecasts. Today, investors will be focused on the ADP Employment Change report, which precedes the publication of the final report on the labor market for January scheduled for Friday.

XAU/USD
Gold prices are falling during the Asian session, correcting after two days of growth and again trying to consolidate below the psychological level of 1800.00. The instrument, as before, is supported by geopolitical risks, as well as evidence of some slowdown in the global economic recovery. In turn, investors are counting on the beginning of a cycle of tightening monetary policy by the world's leading central banks. First of all, the US Federal Reserve is expected to raise the rate already during the March meeting, and now it is being actively discussed how large-scale the correction can be. However, the mood of investors was somewhat cooled by the Chairs of the Fed of San Francisco Mary Daly and the Fed of Philadelphia Patrick Harker, who said that there was no rush to raise the rate, and its sharp increase could be justified only in the event of a threatening rise in inflation.​
 
XRPUSD Market Update by Solid ECN
Consolidation in anticipation of new drivers of movement

Current trend

The XRPUSD pair has been consolidating in the 0.63-0.58 range for the second week and cannot yet start an upward movement, despite a number of positive news for Ripple.

Last week, the company's management announced the repurchase of Series C shares in the amount of 200M dollars, released to the market back in December 2019 to attract investment. This increased Ripple's worth to 15B dollars. It should be noted that the head of the company, Brad Garlinghouse, assessed the past year as the most successful in financial terms. In addition, earlier, Ripple announced a partnership agreement with the British payment company Modulr Finance, which should facilitate entry into the UK financial market. These news could not seriously support XRP, which continues to be under pressure within the framework of the general market trend. Investors expect further tightening of monetary policy in the USA and weakening of the positions of alternative assets, as well as the publication in February of the American state strategy on cryptocurrencies. The document will address economic, regulatory and other issues related to digital assets. Most likely, new forms of regulation of the digital sector in the USA will also be indicated.

Resistance levels: 0.6600, 0.7500, 0.7812.
Support levels: 0.5800, 0.4883, 0.3906.

xrpusd.png
 

GBPUSD market update by Solid ECN​

The market is waiting for the decision of the Bank of England​


Current trend
The British pound is trading with a downtrend against the US currency during the morning session, retreating from the local highs of January 21, updated the day before.

Traders are in a hurry to fix their profits before today's publication of the decision of the Bank of England on the interest rate. Analysts' current forecasts suggest that the British regulator may raise the rate by 25 basis points to 0.5%, and the decision can be taken almost unanimously.

The UK economy is showing a fairly active recovery, and also did not undergo a noticeable weakening in Q4 2021 due to decisive actions by the government, which abandoned the practice of severe restrictions against the backdrop of the coronavirus pandemic. In addition, while the US Federal Reserve is only preparing for a possible rate hike in March, the Bank of England is already proactive. At the same time, further prospects for tightening monetary policy by the British regulator are not entirely clear.

Resistance levels: 1.36, 1.365, 1.37, 1.375.
Support levels: 1.3550, 1.35, 1.346, 1.3435.​

gbpusd_1.pnggbpusd_2.png
 

Silver market update by Solid ECN

The metal prices are consolidating


Current trend
Silver prices show a mixed trend, hovering around 22.50. Market activity remains subdued as traders expect new price drivers to emerge. Today the European Central Bank (ECB) and the Bank of England will release their interest rate meeting minutes. At the moment, the ECB is not expected to make any changes in the vector of monetary policy, but the British regulator is likely to raise interest rates by 25 basis points.

Resistance levels: 22.7, 23, 23.37, 23.6.
Support levels: 22.4, 22, 21.39, 21.

silver_1.pngsilver_2.png
 

EURUSD Technical and fundamentals by Solid ECN​

The dynamics of the pair will be determined by the results of the ECB meeting​


Current trend
This week, the European currency has been gaining in value and is currently trading around 1.13.

Earlier, positive dynamics was supported by data on inflation in the euro area and employment statistics in the USA, which, according to ADP, decreased by 301K in January instead of the expected growth of 207K (this reduction was the first in more than a year).

The pandemic caused by the COVID-19 Omicron strain has put serious pressure on all sectors of the economy, but, above all, on the hotel and tourism

Meanwhile, January inflation in the eurozone rose again. In addition, the Ukrainian crisis may affect the decision-making. In case of its negative development, there will be a threat of interruptions in energy supplies to the EU, and in these conditions it is impractical to reduce economic incentives. Thus, now the market is waiting for the outcome of the ECB meeting, not counting on serious actions by the regulator.

Resistance levels: 1.132, 1.141, 1.1475.
Support levels: 1.123, 1.1145, 1.099.​

eurusd_1.png
 

Meta Platforms Inc

Trading within the global sideways channel


The stocks of Meta Platforms Inc., which owns the largest social network in the world, move within a corrective trend, trading around $322 per share.

Yesterday, the company released its fourth-quarter and full-year 2021 financial results, which met ambiguous reactions from investors. Total revenue for the quarter was $33.671B, up 20% from $28.072B a year earlier.

Thus, despite the growth in income indicators, the most important parameters of revenue and EPS were worse than expected, which could lead to a significant drop in the company's shares today.

The price moves within a global sideways channel, falling within the local trend. Technical indicators keep a sell signal. Fast EMAs of the Alligator indicator are below the signal line, while the histogram of the AO oscillator remains in the sell zone.

Resistance levels: 337, 357.
Support levels: 310, 260.​

facebook_1.png
 
EURUSD Technical and fundamental by Solid ECN
The euro updates local highs


The day before, the single currency showed its most active growth over the past few months, reacting positively to the results of the meeting of the European Central Bank (ECB) on monetary policy. As expected, the regulator left the interest rate at 0% and the deposit rate was kept at -0.5%. Investors expect the program to end completely by the end of March. However, the ECB intends to reinvest proceeds from redeemable bonds under the PEPP until at least the end of 2024.

At the follow-up press conference, ECB President Christine Lagarde also focused on inflationary risks that are pushing officials towards a more "hawkish" stance. However, the regulator still expects that consumer price growth will slow down to the target level of 2% by the end of the year, and therefore the issue of raising the rate is not on the agenda.


Support and resistance
Resistance levels: 1.15, 1.1534, 1.1572, 1.16.
Support levels: 1.1433, 1.14, 1.1363, 1.13.​

eurusd_1.pngeurusd_2.png
 
NZDUSD
Rising amid strong demand for risky assets


The macroeconomic statistics from the USA, published on Thursday, were ambiguous. Thus, Initial Jobless Claims for the week of January 28 decreased from 261K to 238K, better than market forecasts of a fall to 245K. Markit Service PMI was also positive, rising from 50.9 to 51.2 points for January, exceeding the neutral forecasts. In turn, ISM Service PMI for the same period fell from 62.3 to 59.9 points, which was slightly better than investors' expectations of 59.5 points. Traders were also disappointed by the volume of industrial orders, which fell by 0.4% for December after rising by 1.8% in the previous period. Analysts had expected a decline of 0.2%.

Resistance levels: 0.67, 0.6732, 0.6761, 0.68.
Support levels: 0.665, 0.66, 0.6528, 0.60.​

nzdusd_1.pngnzdusd_2.png
 
USDCAD
The pair is waiting for new drivers


The US dollar shows ambiguous dynamics of trading against the Canadian currency during today's Asian session, consolidating near 1.268. Market activity remains rather restrained, as investors are in no hurry to open new positions ahead of the publication of the labor market reports in the US and Canada.

Current forecasts for both countries are quite negative, but Canadian data stand out in this regard: among other things, investors expect the Unemployment Rate to rise from 5.9% to 6.2%. Net Change in Employment in Canada in January may decrease by 117.5K after rising by 54.7K in December.

In the US, investors are expecting modest growth in Nonfarm Payrolls of about 150K after rising 200K a month earlier. In addition, traders will focus on the statistics on the Average Hourly Earnings, which in January may reach 5.2% in annual terms after rising by 4.7% in December.

Resistance levels: 1.27, 1.2746, 1.2812, 1.29.
Support levels: 1.265, 1.26, 1.2558, 1.25.

usdcad_1.pngusdcad_2.png
 
AUDUSD
Australian currency shows neutrality


The Australian currency is showing neutral trading dynamics due to ambiguous macroeconomic statistics, being currently around 0.715.

On the one hand, the position of the AUDUSD pair was strengthened by the report on building permits, the number of which increased by 8.2%.

On the global chart, the price moves within a long downtrend. Technical indicators are in the state of a weakening sell signal: indicator Alligator’s EMA fluctuations range narrows actively, and the AO histogram forms rising bars in the sell zone.

Resistance levels: 0.7182, 0.7315.
Support levels: 0.7100, 0.6991.​

audusd.png
 
Gold | By Solid ECN Securities
Trading participants reduce positions in gold


The development of the global sideways range of 1850–1730 in the gold continues, and the quotes are once again holding slightly above the key level of $1,800 per ounce.

There are no serious prerequisites for the growth of the asset yet, but there are not so many pressure factors either. The situation may change only in March during the meeting of the US Federal Reserve when the regulator's decision to raise the interest rate will be announced. To this point, traders should focus on the US dollar index and investment demand. Currently, the USD Index consolidates at the level of 95.5 after one of the most dynamic falls in recent years, which led to the current upward correction in gold. However, the observed dynamics have little prospects for further development in light of Friday's positive employment report in the US.

Support and resistance
On the daily chart, the price moves within the global sideways channel, correcting towards the resistance line. Technical indicators maintain a sell signal.

Fast EMAs on the Alligator indicator are below the signal line, and the AO oscillator histogram has moved into the sell zone and is forming local rising bars.

Resistance levels: 1830, 1870.
Support levels: 1790, 1720.​

gold.png
 
BTCUSD Technical Analysis by Solid ECN Securities

Current trend

The BTCUSD pair attempted to rise last week and is currently testing the level of 42000 (Fibonacci retracement 38.2%), but for the “bullish” momentum to develop, the quotes will have to break the resistance zone of 42000–43750. In this case, the trading instrument may reach the level of 50000.

The key “bearish” level is the middle line of Bollinger bands around 38500. The consolidation below it allows a decrease to the levels of 34375 and 31250. In general, despite the correction, the downside potential does not look exhausted, which is confirmed by technical indicators.

Bollinger bands are directed downwards, and Stochastic has entered the overbought zone, which may mean the end of the corrective growth.

Resistance levels: 42000, 43750, 46875, 50000.
Support levels: 38500, 34375, 31250.​

btcusd.png
 
NZDUSD Market Update by Solid ECN Securities
Upward correction is likely to continue

Current trend

After the January decline to the levels of 0.654, the NZDUSD is being corrected with the target at 0.67 due to the emergence of investor interest in risky assets.

Reserve Bank of New Zealand governor Adrian Orr is likely to revert to a plan to tighten monetary policy by scaling back quantitative stimulus and raising interest rates to keep inflation from rising. The next meeting of the board of governors of the regulator will be held on February 23. Until then, the instrument will probably trade in a correction.

If there is information about a possible increase in the interest rate closer to the meeting, then the level of 0.67 may be broken upwards, which allows quotes to continue moving towards the key resistance level of 0.6864. Otherwise, the NZDUSD pair will remain under pressure.

Support and resistance
The long-term trend is downwards. At the end of January, the rate of the NZDUSD pair reached the support level of 0.654, which was held by the "bulls," which led to the development of a correctional model with the target at the level of 0.67. An additional factor indicating the continuation of the upward correction is the readings of the RSI indicator, which formed the Convergence signal.

The medium-term trend remains downward. Last week, the key resistance 0.6683–0.6669 was tested. If it is held, the decline will continue with the target at the low of January.

Resistance levels: 0.67, 0.6864, 0.7055.​

nzdusd_1.pngnzdusd_2.png
 
Top