Seeking consistency

GBP news at mid day

I am watching for entry opportunities after the news for GPB pairs

cable is not clear to me in terms of direction, so I am not looking at this cross
further USD (and CAD) also have news out today, so more reason not to trade these two

EUR GPB is a possibility, my indicators (D & 4H) are short, so a push up to 82.80 - 83.10 could provide a short level entry

GBP JPY is also short, so again looking for push up to give a trigger around 130.20

GBP AUD short from 137.50

GBP CHF 157.60

My aim will be to get any position to breakeven if it returns to the pre-news level and then trail my stop to lock in profits
 
Re: GBP news at mid day

I am watching for entry opportunities after the news for GPB pairs

that was a non event

CAD is next, which moved a lot yesterday on news announcements, looking for pushes up to provide short entries on USDCAD & EURCAD
 
Re: Gold - daily bull channel failed - what about the weekly one?

Stop moved up to 1230 (just below last weeks low)

I have opened a second position @ 1240 (initial stop was 1230)

Stop to 1260 now on both positions as price has broken through the previous all time highs and could therefore be about to plummet
 
usd chf potential long

both my daily and 4H indicators are short

I am considering a counter trend trade (depending on the shape of the 4H candle about to close) long as the pair is at levels not seen since March 2008, and have touched the bottom of my descending channel that has held since since early August

Lets see
 

Attachments

  • usd chf 4h set up 22 sept.jpg
    usd chf 4h set up 22 sept.jpg
    127.5 KB · Views: 105
Re: Gold - daily bull channel failed - what about the weekly one?

I have opened a second position @ 1240 (initial stop was 1230)

Stop to 1260 now on both positions as price has broken through the previous all time highs and could therefore be about to plummet

I have opened a third position @ 1270 and moved my stop to 1280 on all three. Momentum appears to be slowing perhaps for the next down swing of this incredibly long bull Market

I expect to take profit when my stops are hit and then wait 4 to 6 weeks for potential new entries long again from lower levels(1250ish)
 
Re: Gold - daily bull channel failed - what about the weekly one?

I expect to take profit when my stops are hit and then wait 4 to 6 weeks for potential new entries long again from lower levels(1250ish)

I have taken off two of my positions and realised their profits @ 1350
I have moved my stop on the remaining position to 1330

My expectation is for profit taking to bring the price down to the 1300 level where I will look to start building some more long positions
 
Re: Gold - daily bull channel failed - what about the weekly one?

Leia;1287880 I have moved my stop on the remaining position to 1330 [/QUOTE said:
All out of gold trade now, waiting patiently for price to fall to 1265 to assess likely hood of a bounce from this level (previous swing high and 50% fib retracement of last up wave)
 
USD CAD potential long set up

I have been a bit quiet recently as I have been trading a 'Counter Trend Strategy' which is obviously completely opposite to my strategy posted at the start of this blog thread.

I have now (hopefully) worked out how I can use both of these strategies, essentially CTS for opportunities to identify early a change of trend and then this strategy to build up the size of my position on a trend following basis

So the explanation for this potential trade is a combination. USD CAD is in a down trend on the daily timeframe, but has perhaps met a strong support level from which it may change direction.

My 4H trend is definitely up and price is above the daily and 4H 20ema

There is CAD news which if it causes price to spike down may provide me with an entry into my 4H long trend, which if the Daily is about to change direction will be an excellent entry position into a new USD CAD long for the next few weeks.

Initial target is this weeks high, which if I do get an entry will enable my stop to go to a break even position

Entry and Stop will be defined by trigger candle on the 1H or 15m timeframe post the news release

If price doesnt get into 1.01 80 to 1.01 60 zone I will not enter

Here's my chart showing my set up criteria of an ascending 4H support trend line a previous resistance support level and a fib retracement level

Lets wait & see
 

Attachments

  • usd cad 4h set up 22 oct.jpg
    usd cad 4h set up 22 oct.jpg
    134.5 KB · Views: 128
4H 20 ma tests

A number of the USD crosses are retracing towards their 4Hour 20ema levels

I will be looking for triggers on the 15m and 1H timeframes back into the main (dollar weakness) 4H trends.


USD CAD 1st up news wise
 
Re: 4H 20 ma tests

USD CAD 1st up news wise

USD CAD 15m indicates a rejection of the level above 1.00 90
so I have paced a sell order @ 1.00 50 with a 40pip stop. Target 100 pips (previous lows) @ 0.99 50
 
Re: 4H 20 ma tests

USD CAD 15m indicates a rejection of the level above 1.00 90
so I have paced a sell order @ 1.00 50 with a 40pip stop. Target 100 pips (previous lows) @ 0.99 50
The U Cad has opened, EUR USD is also right on its asecnding 20ema, I will consider a long position on this pair too, if my 4H candle that is about to close looks like a 'hammer' candle pattern
 
Re: 4H 20 ma tests

The U Cad has opened, EUR USD is also right on its asecnding 20ema, I will consider a long position on this pair too, if my 4H candle that is about to close looks like a 'hammer' candle pattern

Here are the charts (eur usd is frustrating, as it appears to have rejected lower prices (in my 50 / 61.8% retracement zone and found support on its 4H 20ema, but the candle pattern (even on the 1H and 15m) arent giving trigers as the CAD 30min did)
 

Attachments

  • usd cad 05nov10 set up.jpg
    usd cad 05nov10 set up.jpg
    82.9 KB · Views: 120
  • usd cad 05nov10 trigger.jpg
    usd cad 05nov10 trigger.jpg
    65.5 KB · Views: 115
  • eur usd 05nov10 set up.jpg
    eur usd 05nov10 set up.jpg
    81.2 KB · Views: 115
Re: 4H 20 ma tests

USD CAD 15m indicates a rejection of the level above 1.00 90
so I have paced a sell order @ 1.00 50 with a 40pip stop. Target 100 pips (previous lows) @ 0.99 50
I have moved my stop to break even (1.00 50) ahead of the weekend, as I am closing my trading week off now
 
Setting up for the New Year

It's so long since I have posted anything that I had to enter my password (which I couldn't remeber), so its a good job I found where I had written it!

It seems a sensible time to now review this year and make plans for next. Essentially I have had a good year, I put £600 into an account last January and that account now has £940 in, which is a 56% increase.

I credit most of my success in this to my daily and four hourly combination system which I described in my first post. I also had an excellent trade on gold, which was based on the weekly timeframe, however the gains on this trade were wiped out by losses on other trades, so that account is pretty much flat this year. I have consistently lost on my shorter timeframe account (in-fact I have paid more into it than I have won with my 56%er!)

So, with this little analysis what can I learn and then apply to next year?

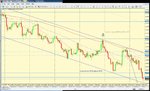
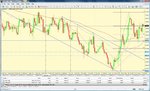
  • continue with my daily & 4hourly timeframe system, as that has delivered a positive out-turn.
  • I need to improve my lower timeframe trading

The first point is relatively easy to address, as I have a system with rules, it has performed reasonably this year
In-fact, I am going to enhance it, as it is a 'with trend' system and I have noticed that there are also some great 'counter trend' opportunities as well. I have a system (in-fact it isn't really my system its Jason's at 4X traders live) which identifies these Counter Trend levels, so I can use them both as targets for my with trend trades and areas to look for confirmation signals of a reversal opportunity

My second point is much more difficult as I haven't traded a system. I have read about a number of systems over the years (Phil 'Newtron Bombs' asian break-out; seeking to capture the average days move from an asian overnight range. Andy 'Captain Currency' Perrys 3 ducks; seeking to identify low risk entries to 4 hour with trend swings. The FX500 club multiple timeframe moving average cross and many others, whose authors and titles escape me at the moment). The problem is I haven't consistently traded one system for a sufficient period of time or number of trades to identify what is and isn't working.

So my ultimate objective for next year (with sincere thanks to both Lance Beggs at Your Trading Coach and Jason Stapleton at 4XTradersLive) for patiently pointing out the (with the benefit of hindsight) bleeding obvious is: to record every single trade that I take, so that I haver some data to analyse each week / month / year to work out what is and isn't working for me. Essentially I am going to religiously post each and every one of my trade set ups onto this blog (as I did for a while this year with my daily / 4H system), with clear reasons for considering the trade, risk and targets. If the trade triggers I will post again what the trigger was (it will usually be a candle stick pattern for a 'with trend' or a significant double or triple top / bottom for a 'counter trend strategy'. At the end of each week I will post a list of all of the trades I have entered and their outcomes, with a monthly and annual summary

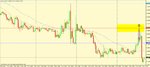
From this additional effort I hope to improve my trading overall, but most importantly on the shorter timeframes. It often suits my life-style to trade the London open / asian range break out around 7am UK time. So I am going to focus on this next year (for my short timeframe trading) and only look to cover a few pairs, for a quick overview and then decide which two or three offer the highest probability of a move to actively look for a short term trade opportunity. My aim being to be in and out (or at worst to have my stop to a breakeven position by 8:30am at the latest) and then not look at the short term charts again until 6:30am to following day.

For my daily / 4 hourly system I will continue to monitor a larger number of major crosses as well as gold, oil and the indices for opportunities. On a three or four times a day basis (when the 4H timeframe candles change at 10am, 2pm, 6pm and 10pm UK time) and when major news releases for one or both of the currencies of a pair on my 'watch list' has been released)

Good luck next year to all, not just in terms of improving your trading but in your life in general

If you want to see what Jason, Lance and Andy do (you may or may not find it helpful to you, but I have been very inspired by all three of them this year and wish to express my thanks to what they so selflessly do each week. btw I have never paid so much as a penny to any of them, although they do offer fee based training too)
Jason
http://www.4xtraderslive.com/

Lance
http://www.YourTradingCoach.com

Andy
http://captaincurrency.blogspot.com/
 
eur cad, short trade set up & trigger

Daily and 4H trends are short
price has retraced to between 50% and 61.8% fib levels of previous 4H down leg
4H candle is a 'shooting star' type, indicating rejection of higher prices
used as trigger for a short trade, with a target of the previous swing low
Entry 1.32 85
Stop 1.33 40 Risk -55
Target 1.31 80 Reward 105 (just under 2X risk)

trade order has been opened
 

Attachments

  • eur cad 28 dec trigger.jpg
    eur cad 28 dec trigger.jpg
    84.4 KB · Views: 111
Re: eur cad, short trade set up & trigger

Daily and 4H trends are short
4H candle is a 'shooting star' type, indicating rejection of higher prices
used as trigger for a short trade, with a target of the previous swing low

In anticipation of the US open, I have moved my stop to breakeven as price has moved half way toward its target and the last two hourly candles both have highs of 1.32 75 (10 pips below my entry / now break even level)
 
eur gpb short, Daily set up and 4H trigger

my daily chart shows a 50% retrace of the last down move, at a previous level that has held as resistance / support this year (see yellow areas highlighted on the attached set up chart)

The 4H chart posted a shooting star @ 10am UK time, and is presently repeating the pattern, indicating resistance to higher levels

I have an order short placed @ 86.00 with a 50 pips risk, targeting the previous Daily low at 83.00
 

Attachments

  • eur gpb 31 dec set up.jpg
    eur gpb 31 dec set up.jpg
    95.6 KB · Views: 117
  • eur gpb 31 dec trigger.jpg
    eur gpb 31 dec trigger.jpg
    96.1 KB · Views: 125
Top