You are using an out of date browser. It may not display this or other websites correctly.
You should upgrade or use an alternative browser.
You should upgrade or use an alternative browser.
TWI
Senior member
- Messages
- 2,562
- Likes
- 269
On the fundamental front, with the incessant central bank bond buying going on pushing yields so ridiculously low..total madness (but that is just my opinion or rather b*llocks position) then I suspect than dividend yield will start to make a lot of stock look very attractive in comparison.
Attachments
bast3k said:there's only one good answer : DIE! 😈
one thing is wishing - the other is what they do.. 😈 :arrowu:
maxpain said:one thing is wishing - the other is what they do.. 😈 :arrowu:
we'll - maybe even today.
that's my perspective how it looks like.
Attachments
bast3k said:we'll - maybe even today.
that's my perspective how it looks like.
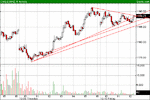
Being long it looks fine for me. Some sector indexes also at cross roads. Bullish at the least.This shoud go up from here
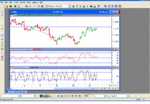
maxpain said:Dow gave a buy signal - minor perhaps but who cares! 😆
R U sure? 🙄 😆
china white
Established member
- Messages
- 979
- Likes
- 12
SPX seasonality
we talked about this seasonality thing briefly before - just came across a nice piece of analysis - courtesy of David Nicholson from 21st Century:
QUOTE: The SPX has entered into a brief window of seasonal weakness that extends (emphasis on the "brief") through Wednesday. Since 1962 the SPX has closed lower on December 15 than it did 3 trading days earlier about 66% of the time (higher 34% of the time)...this in a market that, over all 3-day periods closed lower just 46% of the time (higher 54%).
Beginning on December 16 seasonality turns extraordinarily bullish for the remainder of the year. The only dates between 12/16 and 12/31 that have seasonally negative biases are 12/19 and 12/20. All the other dates are either about neutral or strongly bullish.
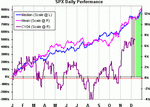
Throughout most of 2004 the correlation between the SPX (purple line) and the average (pink) line has been poor. Since October 25 that correlation has markedly improved to a whopping 0.92 END OF QUOTE
Attachments
bast3k said:R U sure? 🙄 😆
yes I´m sure :cheesy:
china white -about that seasonal chart one should wait until Friday to go long - tripple-witching & oex. I guess they will rally until Thursday p.m until Europe is closed. On Friday they pull the rug. (or the opposite)
Last edited:
china white
Established member
- Messages
- 979
- Likes
- 12
maxpain said:yes I´m sure :cheesy:
china white -about that seasonal chart one should wait until Friday to go long - tripple-witching & oex. I guess they will rally until Thursday p.m until Europe is closed. On Friday they pull the rug. (or the opposite)
matey that is actually someone else's work (quite impressive IMO) and was posted just for illustration purposes. I wud be the last person on Earth to trade on that 🙂
if u ask me tho - it is rare indeed that once 50% retracement is broken, the 61.8% one wud not be tested. And that is 1235-40 on spooz.
Plus the bonus issue that we briefly touched on these forums...... floor lads tend to rely on that lill chunk of money when they go gallavanting round Xmas and NY 🙂 noone wants to spoil the party so to speak..... 🙂
I'm gonna be gobsmacked if the last print of 2004 on SPX is gonna be anywhere below 1225 🙂
"I'm gonna be gobsmacked if the last print of 2004 on SPX is gonna be anywhere below 1225 🙂[/QUOTE]"
I can agree on that but I believe we´ll get a red week coming and the Christmas Rally begins after Christmas. 1184/1185 is what I want so see before going long. Nasdaq needs a break as well.
I can agree on that but I believe we´ll get a red week coming and the Christmas Rally begins after Christmas. 1184/1185 is what I want so see before going long. Nasdaq needs a break as well.
Last edited:
roguetrader
Senior member
- Messages
- 2,062
- Likes
- 49
Trouble with this week is volume coming in light, can't really read a lot into anything. imho.
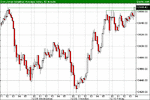
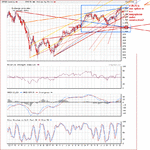
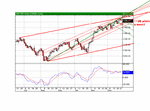
I´ll bet on this one - within the next 3 trading days we´ll probably hit new highs. The chart says ES05H at 1124 could be a ST top? So the Bulls are in control this far. 😱
/this is the future of the index so SPX should top some points lower/
/this is the future of the index so SPX should top some points lower/
Attachments
Last edited:
TWI
Senior member
- Messages
- 2,562
- Likes
- 269
Apologies in advance for my rather chartless conviction here.
I will be a seller of ESH05 above 1223 also sell into any new 10 day lows.
Bulls may be in control but IMO they have overdone it. I would predict a very poor year for US Equities in 2005.
Right now relatively low oil prices, moderate inflation and huge liquidity has created a very favourable environment for over valuation. Cash is King again. I expect to be a little more successful than last time I shorted this product at the beginning of this thread.
twalker said:Apologies in advance for my rather chartless conviction here.
I will be a seller of ESH05 above 1223 also sell into any new 10 day lows.
Bulls may be in control but IMO they have overdone it. I would predict a very poor year for US Equities in 2005.
Right now relatively low oil prices, moderate inflation and huge liquidity has created a very favourable environment for over valuation. Cash is King again. I expect to be a little more successful than last time I shorted this product at the beginning of this thread.
"Apologies in advance for my rather chartless conviction here" - no problem - some of my charts should never have been posted anyway ... 😢 .
My thoughts for 2005 this far is; rally in the dollar due to interest rate hikes - US indexes down - gold down - raw materials up - drugs up(!) - retail down - real estate down - home builders down - biotechs up ................
Not sure it´s the wright time to go short just yet - Euro-indexes could have some upside. Guess "they" keep the US-indexes on top as long as possible in order to get the last bag holder in. Could take some weeks before they pull the plug - expecting the drop to come strategically in the week of OEX in January. 😈
(but what do I know 😉 )
Last edited:

