S&P Index Chart and View

chump said:
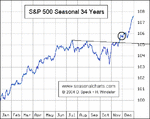
Thanks Max, I'm not being negative or positive here..I just don't see from the chart why one outcome might be more likely than another....you appear to see an event called a "xmas rally" as being the swinger ? I don't know anything about this event...presumably it's been observed before on X number of occasions ? ...if so , why do we expect it to happen again this year? Are there a number of other factors supporting it ?

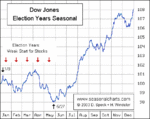
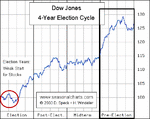
believe there are some statistics saying that the probability is high for that and this year we also have the presidential election year -
 

Attachments

  • valetUSA.gif
    valetUSA.gif
    10.8 KB · Views: 273
  • valet2USA.gif
    valet2USA.gif
    11 KB · Views: 196
Does the American election take place at this time of year always , or does it vary ?
 
hi chump, i'm pretty sure it does, because the inauguration is always in january the following year
 
More to come

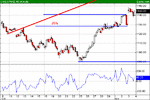
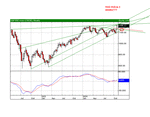
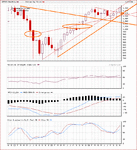
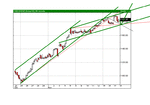
In the 60m chart we got a 25% rebound yesterday and the 3rd wave up is ongoing.
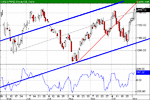
Daily chart; resistance at the upper blue line (from a weekly chart). 1160 next stop?
 

Attachments

  • 0spx.gif
    0spx.gif
    10.6 KB · Views: 242
  • 0spxd.gif
    0spxd.gif
    14.2 KB · Views: 206
Is it over yet? Yes, I believe so..

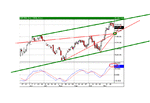
With a 61.8% retrace we´ll hit the 1120-1125 area in 3 weeks. Nice spot to turn up into a Christmas Rally.
 

Attachments

  • 0spx1.gif
    0spx1.gif
    15.2 KB · Views: 280
  • spxm.gif
    spxm.gif
    32.6 KB · Views: 223
Last edited:
Found some interesting charts..
 

Attachments

  • sxgann2.png
    sxgann2.png
    10.5 KB · Views: 215
  • spxgann1.png
    spxgann1.png
    10.7 KB · Views: 248
It looks to me as if the S&P500, DJIA and FTSE (also NASDAQ100?) are all overbought at the moment with RSI(14) at 70ish and RSI(5) over 90...Possibly ND on FTSE...?

Perhaps the outcome of the US elections have pushed indices unsustainably high?

I'm looking for a short opportunity here - what do people think to shorting if indices make a lower low to previous day's price? Ideally I'd like to wait for a sell signal (a la Rivalland swing trade theory) but fear I might miss alot of the action here?

Whaddya think, folks?
 
Safehaven´s view of the future (Robert McHugh)

Incrediblecharts

"Current trending markets may be:
stocks - up for NT/ST and S-I term, neutral for IT, down LT
bonds - neutral for ST, down for S-I, IT, LT term
gold - neutral/down for NT,neutral for ST, up for S-I/LT
crude - neutral for NT/ST, up for SI-IT,LT term
USD - neutral/up for NT, neutral for ST, down for S-I,IT,LT

NT= near term of 1-3 sessions
ST= short term of 3-10 sessions
S-I= short-intermediate term of 2 weeks to 2 months
IT= intermediate term of 2-6 months
LT= long term of 6-18 months "

Amateur-Investors
 

Attachments

  • spx-safehaven.png
    spx-safehaven.png
    47 KB · Views: 255
Last edited:
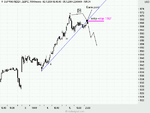
How about a nice drop to the 1175-area into OEX tomorrow. Wipsaw?
 

Attachments

  • 0esz.GIF
    0esz.GIF
    11.8 KB · Views: 222
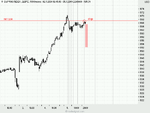
Looks as if 1072 wasn´t enough - 1164 is 25% down from top so it might be the next long entry level. Couple of days sideways or slightly down in the US. The rally isn´t over but guess we´ll get some nasty days in Europe. A declining dollar doesn´t mean declining indexes in the US. Europe is another side of the coin.
 
Maybe one or two weeks of consolidation before we see new rally attempts?
FTSE
 

Attachments

  • 0spxseason.gif
    0spxseason.gif
    10.4 KB · Views: 226
Maxpain

Thanks for the posts - I've not said much (anything??) yet but you're making this a v useful thread.
 
peterpr said:
Maxpain

Thanks for the posts - I've not said much (anything??) yet but you're making this a v useful thread.

Thanks - I´m posting and trading what I see as possible directions for this important index. My thoughts for the next 1-2 weeks are that many options/warrants expire in the beginning of December and the majority of them are buy options. That´s why I´m negative short term. US are closed Thu/Fri. Monday is their next trading day. If they pull the indexes down until US close on Wednesday they have sucked in a lot of new put-buyers. On Thursday we open low and maybe on Friday start heading north so on Monday a lot of option buyers are on the wrong side. So... I´m short at the moment ;-)

(weekly candles might give us a clue as well.- 1190 in the monthly chart is resistance so the top might as well be in)
 
Maxpain,
I notice that the charts you post do not show volume. Do you look at volume as part of your trading plan?
JO
 
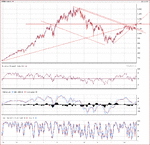
Lycos has no volumes on the SP500. Volumes are important - I only look for volume changes when other indicators are at extremes. Low volume and MACD/RSI on a bottom could indicate a change of trend on way. But first one wants a volume spike because there´s a lot of manipulations out there due to the options. Channel/Cycles/Pattern-trading are some models. I guess I mix all of them to determine if it´s a buy or sell. Not an easy task anyway. You never know anything in advance. Old trading patterns usually repeat themselves. I believe that I´m more wright then wrong these days but it has cost me a lot to get where I am today. The best way to take part in this market is to do your DD and buy on long term. Hard to beat indexes even for pros. When trading sectors - US-sector indexes are very useful. Discipline in trading is the most difficult thing to learn. If I believe in a long term trading pattern for an equity I either go long or short and stay. Hitting bottoms or tops is almost impossible. Never trade on the opening wave - more to come as usual. You often get those spikes when the market is about to close - either scaring longs or the shorts out of their positions. I often go the opposite way if other indicators are pointing in another direction.
(could probably write a book on how to avoid many mistakes you do as a newbie - I still make mine but fewer today than yesterday)
GL
 

Attachments

  • 0spxlong.gif
    0spxlong.gif
    44.5 KB · Views: 247
Last edited:
Still believe we´ve seen the top for a while. End of next week 1164, 26% of 1190-1089. Many options/warrants expire next Friday and with extreme low P/C-ratios "they" will not move the indices higher. Then there is the dollar too. /JMO as always ;)
 

Attachments

  • 0es04z.png
    0es04z.png
    23.8 KB · Views: 222
Last edited:
Top