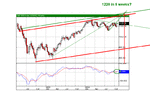
S&P Index Chart and View

Hi max,
I agree with some of what your saying. The 1115/17 level is important, but I’ve stop trying to make assumptions on the direction (a bit like Bradley). I’ll wait until it stays strong above that level & then look at a long & for a continuation of the short, some strong lows under 1100. But this is just my opinion & over the next few days these figures could/will change.
I like the weekly chart, some interesting points in there. I never thought about using weekly’s – thanks max.
 
JFK said:
Hi max,
I agree with some of what your saying. The 1115/17 level is important, but I’ve stop trying to make assumptions on the direction (a bit like Bradley). I’ll wait until it stays strong above that level & then look at a long & for a continuation of the short, some strong lows under 1100. But this is just my opinion & over the next few days these figures could/will change.
I like the weekly chart, some interesting points in there. I never thought about using weekly’s – thanks max.

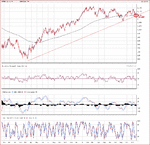
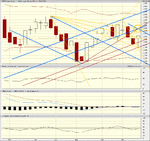
Hi, weekly as well as monthly charts are the best - no disturbing moves - almost as the PF-chart - usually works well and the MM´s tends to move the market following Gann lines and Fibbonacci levels.
 
Bad sign!

Let´s see how this pans out..
 

Attachments

  • spx2y.gif
    spx2y.gif
    57.5 KB · Views: 257
Sorry guys - I just don't believe in any of these lines. The only real line is a straight one (horizontal that is). Everything else is just an illusion. I'm sure most won't agree - but I see no logical reason why trendlines should work - unless for the players seeing the same lines. As you've all pointed out on this thread there are a hundred ways to draw these lines. max's lines are everywhere - there's every chance they will liik to affect price.

Don't want to be negative - just a warning for other would be traders that it may not be the tight way to go.
 
Tubbs said:
Sorry guys - I just don't believe in any of these lines. The only real line is a straight one (horizontal that is). Everything else is just an illusion. I'm sure most won't agree - but I see no logical reason why trendlines should work - unless for the players seeing the same lines. As you've all pointed out on this thread there are a hundred ways to draw these lines. max's lines are everywhere - there's every chance they will liik to affect price.

Don't want to be negative - just a warning for other would be traders that it may not be the tight way to go.


The lines are not everywhere. Some lines are transfered from a 2y chart and the others are drawn from earlier support/resistance levels. I think it´s a matter of how the inventor (Gann) would have done it combined with how the market trade these levels. Agree that horizontal lines are most important in big charts but inbetween these levels they trade the trends in certain patterns. I still believe the weekly top is where we are at the moment. Made 6% in early morning trade and have shorted this mess 100% now.
 
Last edited:
Each to their own - just don't believe in Gann or Fibonnacci myself - lets hope the short call is right.
 
Well - if we got about 34p from 1092-1126 it only a matter of time bit as sure as the sun rises above the horizon every day you´ll get the retrace levels (26.4%.. 38.2.. 50.. 61.8 . ..) and they are tradeable so if this was a top we will visit either 1117, 1113, 1109.... the trend is your friend and the only problem is to determine if it´s an up- or down-trend. I believe we are in an expanding triangle at the moment which will be resolved downwards. Also guess we have a 7 day high today - next days will probably be down/sideways until the US knows who will be the next president.
(lots of guessing in this business :)
 
It's guessing the right way that's the problem. I use Market Profile (Auction market theory) myself. I find this to be pretty good in terms of reading the market - but it's only as good as your last day. i.e. no real 'forecasts' can be made - but topping & bottoming formations are quite good. Yesterday was a good up move according to this method. Overhead resistance is high though. I thinkg the market is going to try higher prices first tough. As there was slight rejection of lower prices & no proper retest of the upper levels. these tess will come soon & may well signal a larger down move - who knows yet?
 
nobody knows but the big boys don´t do this for fun and the losers are on our side of the fence. MACD RSI Bollinger - all indicated that we were close to a top. Might get some sort of retest or attempt to run it up again. I´m just studying the patterns as well as the short indicators & fundamentals and often trade opposite to what the market expects. I´m not a big winner but on the other hand I´m not a big loser either. I often trade for a couple of hours in one direction so if I´m short at the moment doesn´t mean that I´m staying short all day. Over night trading is dangerous as well as Friday afternoons

adding - Initial claims could be good so I guess they will park the ES04Z at 1117 something when the numbers are public. From there we could rally or go down to next fib. level so it´s a mixed picture. On the other hand, the P/C-ratio is extremely low and that indicates that they´ll pull the plug to make as much damage as possible. It´s not a game based on fundamental economy - it´s a game where the big money can manipulate the futures in any direction.
 
Last edited:
Thanks for the advice max & nice call max re: post 21 ‘Just some thoughts for the coming week..’
 
Thanks, only posting my thoughts - wright or wrong. Am trading as I say so no BS from this corner ;-)

Telecoms still in bull mode so there are some picks to do. Drugs could also rally if/when they are going to turn up again. Don´t think it´s time to go long yet though.
 
SPX500 1220 in 6-8 weeks?

Time for this index to start moving - no rally without big caps. SPX/OEX quote too low for any rally. Same goes for the relation between NDX/COMPX.
SPX might get a buy signal in the PF-chart today. Futures on fire this far.
 

Attachments

  • spxweek.gif
    spxweek.gif
    15.8 KB · Views: 200
  • spxPF.png
    spxPF.png
    32.3 KB · Views: 185
Last edited:
chump said:
"1220 in 6 weeks" maybe ,but why not 980 in 6 weeks ?

Anything is possible but don´t forget the Christmas Rally so my bet is that these indices will hit highs at the end of this year. 980 will come later in 2005 I guess. September 2005 could be next entry date for those long term investors. Why not enjoy this ride if it´s here. I was extremely negative until yesterday. Don´t get hanged for being wrong I hope?!
 
Thanks Max, I'm not being negative or positive here..I just don't see from the chart why one outcome might be more likely than another....you appear to see an event called a "xmas rally" as being the swinger ? I don't know anything about this event...presumably it's been observed before on X number of occasions ? ...if so , why do we expect it to happen again this year? Are there a number of other factors supporting it ?
 
Top