S&P Analysis

Analysis 03/02/2012

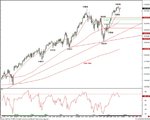
The S&P is confirming further consolidation interior the outside day with 1378,00 – 1357,00 still the levels to follow in the coming hours. A daily closing above 1378,00 will support higher levels, scenery that only a break below 1357,00 will be able to abort!!! The indicators of the daily chart are still well positive but they are also still well overbought. Those of the s/t ones are mixed suggesting further consolidation for now. The suggested potential negative reversals has disappeared. While above 1368,00 we expect a break above 1377!! We remain on the sideline.
 
Last edited by a moderator:
Analysis 03/08/2012

The S&P confirmed a positive closing while remaining interior the range of the previous session forming a new inside day with 1366,50 – 1337,50 the levels to follow in the coming hours. The indicators of the daily chart are well negative but those of the s/t ones turned all above the line following the rebound. The move up already favoured attest of the 200 hours line at 1362,79 with even an overshooting suggesting a test of the 1365 resistance area . the indicators of the hourly chart show already an overbought situation. We suggest however waiting for a possible 1370 overshooting before selling. Today anything can happen!!
 
Last edited by a moderator:
Analysis 03/13/2012

The S&P confirmed a session of consolidation interior Friday’s range forming a new inside day with 1370,00 – 1356,50 the levels. It already confirmed an overshooting this morning suggesting further upside potential but forming also a gap up area. The indicators of the daily chart are however still below the line but a strong closing tonight could turn them up. Those of the s/t ones are positive with bearish divergences supporting a positive tone. Possible therefore further strength; however in case of a 1380 overshooting before the US opening we will try a short position for a retest of the 1370 area!!
 
Last edited by a moderator:
It seems that we are going to have some consolidation in SP500 in the beginning of the coming week.
 
The S&P 500 is still stalled beneath the 1695 recent high, and with daily momentum turning lower, the corrective risk remains Below 1672/70 is needed to keep the immediate risk skewed to the downside for last week’s low at 1666. This though remains seen as critical, as a break below here would see a better top established. Indeed, a close below here today would see a bearish “reversal week”, which would begin to raise the prospect of a potentially larger reversal (a “double top”). Above 1688/89 is needed to reassert an upward bias for a retest of 1695/96. Beyond here can target 1702/03 next, then the 1708/16 Fibonacci/medium-term trend channel resistance cluster. The VIX has managed to hold resistance at 13.50, with a push above here needed to see the risk stay higher, for 14.56.

Holding a long stop/reverse below 1666. Square longs on strength to 1705/10 and try a short, stop above 1716. Below 1666 would see a top, for a decline to 1658, then 1648, where we would cover. Read more
 

Attachments

  • 1.jpeg
    1.jpeg
    76 KB · Views: 257
Last edited:
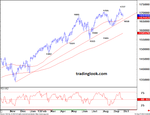
The S&P has extended its slide and has now refilled former gap support below 1683. This leaves the immediate focus on support showing next at 1675/70 – the 63-day average – where we would look for buying again to attempt to show. Beneath here is needed for a test of trend line support from the November 2012 at 1658/51. Only removal of the latter would suggest a more protracted correction is underway. Resistance moves to 1697, but above 1701 needed for a base and turn higher to 1707. Above the latter is needed to turn the trend higher again for 1719. The VIX has surged up through 14.68/71, opening up a move higher in the broader sideways range to 16.18, above which would aim at the August peak at 17.81, which we would look to cap.

Flat, buy at 1675/70, stop below 1658 for 1725. Below 1658 would aim at 1651 and through here for 1639.
 

Attachments

  • SP500.png
    SP500.png
    29.2 KB · Views: 218
Top