barjon
Legendary member
- Messages
- 10,752
- Likes
- 1,863
Right, Split. This is how I see it, I know always MUCH easier in hindsight:

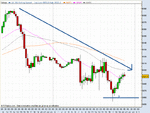
There's more entries there even just taking it on this chart than I've listed, more aparently profitable than not (whether they actually were I don't know), short entry number one straight after the green momentum bar, but it had made a base before coming back followed by the upward momentum, the market was showing its hand with an evident supply zone. I wouldn't have taken any though as there just isn't the range between supply and demand here for me. 2nd long entry playing on this chart only is the probable stop out as it spikes through the entire supply level, following this a short MAY fall through the level (in this case it did) as price has traded all the way through the level before coming back but it's a much riskier play, for us to know a level has truly gone price needs to go through it and close i.e. it's well and truly broken...so given that and if it isn't going to fall through but come back again the potential reward isn't there in this instance. Which leads on to something else I've not shown yet but we all know about and see all the time ...flips and just what is the first pullback...hmm???
mmm, you might be right but your circled bit is reflective of the non-farms news reaction on the dow and not reflective of "true" supply and demand so far as ftse is concerned. The clue about that is in the degree to which ftse paralleled moves in the dow.
jon


