Retracement strategy development

sulong said:
OK , a couple of questions.
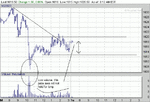
first, starting at the far left of the chart on page 1, with in the context of "ret" at what point is your entry, that you would exit from between 4 and 5?

And if you don't mind, at which point is a "ret " type entry no longer appropriate to the market conditions?

From where I sit, point 6 is the is the place I view as a change of tactics are called for, until or unless I see a BO from the range.

Entry would be at #1 and #3 would confirm entry point. The reason for exit is because at the small consolidation (red circle) sufficient supply should have been absorbed to continue upward and then if tentative resistance(#2) became true support then price would hold here. As it did not hold that indicates sign of weakness , price now trendless. It did hold at one time but then price fell through.
At which point is a "ret" type strategy no longer appropriate?................Good question as I am always looking for narrow consolidations and breakout/ rets from them. They don't occur every other day, sometimes take a month to get one. Not sure I can answer that one for you Sulong.
I'm not an active trader, but look only for the setups. Sometimes I just miss them.
If you were to look a #10 and see the narrow consolidation. I would take a "ret " from the breakout there before volume came in , rather than wait for price to go past resistance at #4 and #8. Ditto if price went to the downside.

erie
 
If I may, the two of you are making something of this other than what was intended, which is perfectly okay, but I want to make sure you understand what the example is for. You can then do with it what you like. But it's next to impossible to address the kinds of questions you're asking without knowing what happened prior to the left edge.

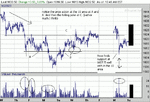
"Rectangles" is about rectangles. It illustrates support, resistance, reversals, breakouts, and retracements. There is only one clear retracement here within the context of the illustration, and that is the RET that occurs after the BO at 11. The "RET" at 1 is only a possibility since you have no idea what came before it. Ditto the "RET" at 3.

If one did enter or pyramid at 1, then no other RET entry is appropriate after "1a" since there is no RET after the BO before 4 (if you took one anyway, you'd be SO), and the trend is halted, though not reversed, by the time you reach 5. If the original stop is placed under 1, there's no reason to exit, though one might do so if he wants to. But this is purely a matter of trade management and the choices one makes, not appropriateness or inappropriateness.

Again, the point of this particular example was to show how to determine S/R and to illustrate a true BO, i.e., at 11. There's certainly nothing wrong with working from the left edge. In fact, the most common error which novices make is to trade the chart in hindsight rather than start at the left edge and analyze it bar by bar as though they were seeing it unfold in real time. However, if you're going to focus on RETs, you might find the charts on pages 3 and 4 to provide more meat to chew on.

Edit: To continue, the charts in all the pdfs, including these, are intended to illustrate principles, not to work as templates. Every day is new, and the challenge to the trader is to interpret what the market presents him with that day. Therefore, studying these illustrations in order to internalize the principles is useful; studying them in order to memorize some "pattern" is relatively useless. If you want to break down a chart, an excellent and much more contemporary example can be found in PFB. Plot a 2yr chart of this above a 2yr chart of the NYSE and chew.
 
Last edited:
dbphoenix said:
If I may, the two of you are making something of this other than what was intended, which is perfectly okay, but I want to make sure you understand what the example is for. You can then do with it what you like. But it's next to impossible to address the kinds of questions you're asking without knowing what happened prior to the left edge.

"Rectangles" is about rectangles. It illustrates support, resistance, reversals, breakouts, and retracements. There is only one clear retracement here within the context of the illustration, and that is the RET that occurs after the BO at 11. The "RET" at 1 is only a possibility since you have no idea what came before it. Ditto the "RET" at 3.
.

Yes understood. The rectangle here also has a good example of a hinge and /or springboard as well at price below #10. All rectangles or bases will not have this . When this does show up it is worth keeping an eye on for trading purposes

erie
 
erierambler said:
. When this does show up it is worth keeping an eye on for trading purposes

erie

Particularly if the market confirms. You'll notice this if you juxtapose the NYSE with PFB. It's as if the chart is saying "buy here, stupid" :)
 
dbphoenix said:
Particularly if the market confirms. You'll notice this if you juxtapose the NYSE with PFB. It's as if the chart is saying "buy here, stupid" :)

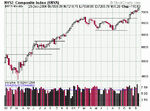
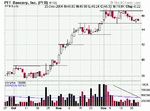
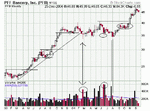
Like this?
 

Attachments

  • $nyse 2yweekly.gif
    $nyse 2yweekly.gif
    14.9 KB · Views: 371
  • PFB 3 mo.gif
    PFB 3 mo.gif
    12.6 KB · Views: 328
  • pfb 2y weekly.gif
    pfb 2y weekly.gif
    15.3 KB · Views: 336
sulong said:
Like this?

If you're buying the springboard, yes, but I haven't talked about that much. There's no retracement, of course, until after the BO in November.

The buypoint I was referring to was the double bottom, but perhaps that's more off topic than you want to get. On the other hand, my advice to get the RET/BO side worked out first may not have been the best. True, it's usually a bad idea to throw too much at people all at once. But everybody has his own mix of induction and deduction, and perhaps it's better to discuss all three strategies at the same time: RETs, BOs, and REVs. Otherwise, you're stuck with talking about what a reversal isn't but never getting around to what it is (at least until the RET strategy is worked out). Perhaps understanding a retracement will come easier if retracements and reversals are discussed simultaneously. Not trying to push anything. But it does seem like a more natural way of proceeding.

Either way, just apply what you read in Ws and in the Practicum to that double bottom and you should see your buypoint.
 
For some time I have wondered why these discussions about support / resistance, retracements etc, take place essentially in a vacuum from discussion of the broad market behaviour. After all when the broad market indices go up, in general most stocks go up and when they go down most stocks go down.

It is as if TA should be confined to looking for the whole truth in a single OHLCV time series, whether by patterns, oscillators, Elliot Waves, price and volume, S/R, neural net trading signals or whatever.
I guess it sells books and courses anyway.

All the broad market indices and all the sector indices are aggregates of the component stocks in the index or sector index. There is a lot more data available than just the individual price series for a stock and it's index (or a for that matter a futures contract).

Anyway, after that whinge, I'll post something that I think is very interesting for use with S/R and pullback type trading, that uses a sort of a market breadth indicator that I have been experimenting with.

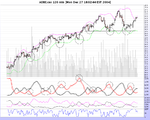
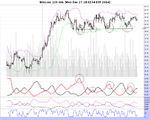
On the attached 120 minute chart of ADBE, the subchart second from top contains two 'indicators' (for want of a better term) and with their 3 bar SMAs overlaid for a little smoothing. The red 'indicator' is calculated as follows. Calculate the Trix for each stock in the SP500. For each bar, aggregate the number of consecutive down bars for each stock, ie if ADBE has had 3 consecutive down bars, it's contribution to the 'indicator' is 3 on that bar.

The black 'indicator' is calculated in the same fashion as above, but for up bars. The red and black indicators are smooth and frequently have well defined turning points that correspond very closely with index pullbacks or reversals.

I think the markup on the chart says it all. The black 'indicator' can be used as a guide to exits. I have many, many chart examples of this type.

One can also use the same indicators for shorting. Of course if you want to short a strong bull market you'll likely get burned.

I have experimented with all sorts of time frames including weekly, daily, 120 min, 30 min and down to 10min bars, and these 'indicators' appear very useful on all time frames of 10 mins or more. Also on all major US indices, and several US sector indices and also on daily FTSE and daily DAX.

FYI the 3rd from top subchart is just an experiment showing the sum of DMI+ and DMI- over all the SP500 stocks. Not a lot of use IMO.

The bottom plot is a 2 bar Wilders RSI. If you're feeling aggressive on a pullback entry then a very low RSI 2 (< 5) is not a bad entry point.

Comments please.
 

Attachments

  • ADBE.csv120.jpeg.png
    ADBE.csv120.jpeg.png
    111.2 KB · Views: 281
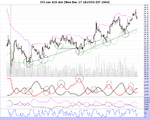
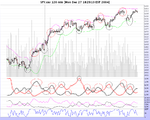
And here are marked up charts of the SPY (120min bars) SYK, and WAG as further examples.
 

Attachments

  • WAG.csv120.jpeg.png
    WAG.csv120.jpeg.png
    111.6 KB · Views: 253
  • SYK.csv120.jpeg.png
    SYK.csv120.jpeg.png
    111 KB · Views: 254
  • SPY.csv120.jpeg.png
    SPY.csv120.jpeg.png
    115.7 KB · Views: 313
dcraig1 said:
For some time I have wondered why these discussions about support / resistance, retracements etc, take place essentially in a vacuum from discussion of the broad market behaviour. After all when the broad market indices go up, in general most stocks go up and when they go down most stocks go down.

In everything that I've written, the market comes first, then the sector, then the stock, and while it may be true that "most stocks go up", that doesn't mean that the stock that the trader has selected will. Which is where defining and testing the setup comes in.

As for indicators, I don't use them, so I can't help you there. :)
 
Sorry, I'm a little late, but the I didn't switched on my computer during the holidays.

If you want to discuss all three strategies in one thread I'm totally comfortable with it.
I read back and have one question: Why point 3 is a ret? In my view the TL was broken, a lower high and a lower low was formed, so when the price reached point 3, it was in a down trend.

Where am I wrong?

Szimba
 
Szimba said:
Sorry, I'm a little late, but the I didn't switched on my computer during the holidays.

If you want to discuss all three strategies in one thread I'm totally comfortable with it.
I read back and have one question: Why point 3 is a ret? In my view the TL was broken, a lower high and a lower low was formed, so when the price reached point 3, it was in a down trend.

Where am I wrong?

Szimba

As I said, since you have no idea what came before, 1 and 3 are only possible RETs. The pdf is about rectangles, and the first chart was used to illustrate rectangles, not retracements. Later charts provide better examples.

As for the "lower high and lower low", these may be irrelevant since you have no idea where the trendline is (because you don't know what lies to the left of the chart).

All of which is why I suggested using PFB if this is the direction sulong wants to take the thread. By looking at PFB or something similar, one can determine the trend from the beginning of the trend and not wonder where the line is supposed to be.

I emphasize that this is sulong's thread and that he initiated all this in order to strengthen his understanding of retracements. Granted, a journal might be a better choice for delving into this, but images can't be posted to journals, so here we are. In any case, he might find it easier to reach his Aha! if he attempts to put it all together and do a real honest-to-God Wyckoffian analysis of PFB. However, that means consolidating everything from Trendlines, Ws, the Practicum, Bases, Rectangles, and possibly Bottom Fishing and Stalking, with a sprinkling of Dow Theory (which may be difficult because I haven't written it yet). He may not be ready for that. Which is fine. Everyone has his own way and his own time (recall "It's the Journey").

So, as far as I'm concerned, it's up to sulong. Putting all of this together prematurely could be extremely frustrating, and progress is not accelerated by frustration (which is why these threads have been such a pleasure compared to whatawasteoftime.com).
 
My point is that there are sources of (technical) information available other than just the chart of a stock and say the chart of the SPX or NDX. One of those sources is the price behavior of the stocks in an index or sector. This is not fully captured by construction of a market cap weighted (or price weighted) index. I'm suggesting that there are productive and possibly novel ways of using that information and it seems to receive too little attention. And yes, I know about the run of the mill broad market indicators such as advance/decline, trin, McClellen Summation index etc, etc. I guess for some traders, eyeballing a lot of charts may provide that. I recall looking at a bunch of semi (SOX) stocks in Dec 2003 and thinking that a lot of breakout patterns were forming. It should have been a hint about the first couple of weeks of January.

What I'm trying to do with the 'indicators' shown is to find market reversal points (ie changes in market sentiment) by means other than applying some analysis to the index time series. These can be combined with S/R and and other analysis of individual stocks. From the many charts I've examined, they look strikingly effective in all but the most powerfull broad market trends.
 
If you're referring to surrogates, I agree, and I've addressed that elsewhere and you're right, they can be very informative. As for the indicators, I had a thread on the subject of price/volume, support/resistance in General Chat which we can re-awaken if you like (http://www.trade2win.com/boards/showthread.php?t=11104), but indicators are not germane to this particular thread, unless sulong changes his mind. :)
 
Last edited:
OK, I won't clutter up this thread. I guess what I was mostly trying to illustrate is that bounces off support are intimately connected to upturns following a market pullback and that there are possibly techniques for pin pointing these reversals that are not commonly used.
 
Thanks for the comments guys.
Personally, I like the idea of doing a "Wyckoff" like analysis and working on all 3 types of strategies at the same time.
My contributions this week maybe far and few between. I've got a lot going on right now, with the end of the year clean up, and the beginning of the year preparations and so forth.
Also that Tsunami isn't helping much, still waiting to hear from some people.
 
No hurry. But it's important to emphasize the Wyckoff-like part, since I focus on the principles of his approach and not the details, such as position sheets and wave charts and P&F. Understanding the principles is the biggie, and most people don't want to bother. Too "soft". :)
 
OK, here it goes

Beginning with the NQ daily chart I posted in the 3rd post in this thread.
NQ has been in a trading range for the month of Dec. Finding a support area in the 1610 area. And resistance in the 1640 area.
So as long as we’re trading in this area, we have a defined top and bottom in which to enter and exit trades.

And now we have a 15m chart of the last 10 days (2 days added since the daily chart)
I’ve tried to illustrate the range which I believe to be important.
The pokes through the upper part of the range seems to be weakening that area.

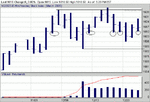
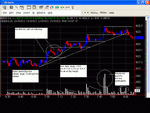
And now we have a 5m chart of yesterday (12/27). Notice how price found the “10” area, and selling interest fled from there like a thief in the night.
The low volume the rest of the day is of special note.

And now we have a 1m chart of this morning (12/28)

Again, note the low volume during the opening range, and then the BO and following RET’s opportunities.

PS.
When I get into analyses, I generally look for a “normal” type of P/V behavior, and then look for extremes in which to focus on.
 

Attachments

  • 1.GIF
    1.GIF
    10.9 KB · Views: 272
  • 1b.GIF
    1b.GIF
    13.5 KB · Views: 275
  • 1a.gif
    1a.gif
    16.4 KB · Views: 293
  • 1c.GIF
    1c.GIF
    31 KB · Views: 276
Nice of you to share your analysis Sulong. Your annotations help me as well and am following along.
As for Dec .27, did you take note that opening price auctioned above previous day's range?

erie
 
erierambler said:
As for Dec .27, did you take note that opening price auctioned above previous day's range?

erie

Yes and no.
I check out the over nite action before I begin my day, to check if S/R is being respected, and make note of where unexpected S/R might present itself.
Other than that, I don't place special significance on the open.
 

Attachments

  • over nite a.GIF
    over nite a.GIF
    13.3 KB · Views: 243
Top