Profit / Loss Analysis

Long-term analysis of the EUR/JPY shows a clearly visible divergence, each new high of the current uptrend reaches lower values on the MACD. However on the monthly chart the clear convergence is formed and the key level of 170.00 (which was previously reached in 2008) is seen as a target for further growth.
The distribution of indicators suggests that:

- Before a new attempt to reach 170.00 within the current global trend, the correction is highly possible.
- On lower time frames the market will test the current local maximum of 165.350
- In case of 165.350 confidently broken, then the divergence will probably continue and the fall will be started from the level 170.00
- If the local maximum is not broken and the price begins to fall, then it is probably the start of the correction, which could continue to 162.700 and lower to the daily EMA 100 and key support 160.300.

In this situation, it is also important to note that on the four-hour chart the price level is paced higher than EMA 100 and EMA 200 lines, which is a signal of further growth. The marker levels to pay attention to in case of buy are: 165.00 and 165.350, in case of sell are: 163.500 (coinciding with the four-hour EMA 100) and 162.700 (in the area of influence of the EMA 200).
I will continue to monitor the situation on EUR/JPY and am going to enter the market to catch movements on the hourly and four-hour charts between the marker and key levels that I indicated.

EURJPY April 08 (JE1Ufn).png
 
There are four successful trades were closed on GBP/JPY during the growth and following correction on April 8-9. The MACD indicated further growth, while the EMA lines became far below the price level on short-term and long-term time frames. Moreover, the key resistance at 192.130 was not strong enough to stop further breakout and growth.
I was counting on a more volatile rise to 193.500 and a sharp drop back to the level of the current price, but unfortunately, I had to trade fewer points and close buy trades earlier. After a successful long, I waited for the correction to begin and started short with the aim of falling to the key level 192.130 area. As you can see from my trading statement, these sell trades were also profitable.
As a final statement, I would like to note the dawdown during sell trades and the risk of further growth when the price reached 192.860. There are a few things I can take away from this situation:
- I will work on improving the exit from the market, because the buy profit could have been taken at the maximum level of 192.860.
- The good point is that I did not close the loss at the top, knowing that according to my data, a correction will follow.
GBPJPY profit loss Apr 08-09 (Heiyc3).png

gbpusd trades Apr 08-09 for.png
 
The current Bitcoin fluctuations is part of a correction that has a horizontal channel between the key levels of 60K and 73K. At the same time, on the daily chart it is clear that the level of 60k is strengthened by the influence of EMA 100, but with some divergence and the prospect of MACD entering the zone of negative values.
The weekly chart shows pure convergence and a preliminary increase in the probability of crossing the signal line as a sell signal. Thus, if the 60k level is broken below, then I will expect a likely further decline to 50k, where the daily EMA 200 line has been formed and also the key support of 51k, which will prevent the decline.
But in the short term, I see that growth is also possible, at least within the current horizontal channel with the initial marker level at 65k. Moreover, the four-hour MACD shows initial signal to buy. In case of 65k level breaking through the level of previously maximum point 73k may be a significant resistance for further growth of BTC. And further 73k level passing will open up new prospects for Bitcoin and make it possible to realize the potential for maximum historical values, but I suppose that for now it is quite moderate (75-80k).
I see prospects for further growth within the horizontal channel, but I suggest keeping an eye on the marker and key levels of 60k and 73k, a breakthrough of which will mean a unidirectional movement.
Btcusd April 18 (Iuen43).png
 
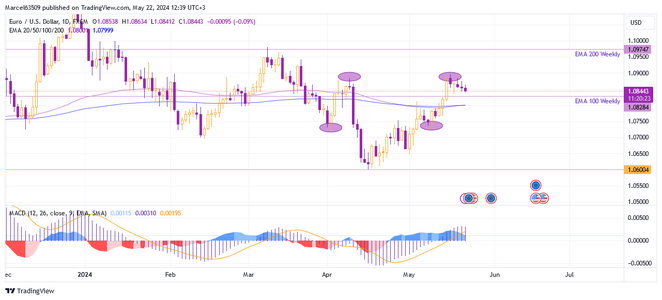
EUR/USD took a break before possible growth. The current Weekly Euro Dollar chart suggests two key aspects that can be identified: the intersection of the EMA 100 and 200 lines, which is a signal of a possible continuation of growth, and the MACD moving into the positive values zone with a confident margin and convergence with the upward local trend. It is also important to note that the recent growth last week allowed to cross the EMA 100 at 1.08230 on the weekly chart and even form the initial MACD signal. I believe that we can now consider the possibility of further growth on the weekly chart with the goal of reaching the EMA 200 at the key level of 1.09750. This growth will be possible only after the completion of the local correction and further breaking through the key level of 1.08850.
It is also possible to expand the current correction if the marker level 1.08350 is broken and the uptrend is changed, after the daily EMA 100 and 200 crosses at 1.08000. This option will open up the prospect of a fall to the level of 1.07300.
 

Attachments

  • Euro Dollar May 22 (jf49iu).png
    Euro Dollar May 22 (jf49iu).png
    93.4 KB · Views: 11
LUX trading today was quick and didn't follow any long term goals. The task was to catch the minimum impulse after the impact of key historical levels.
The EUR/USD was close to continuing to rise and I was ready to accept some drawdown, but the sell chosen due to a clear MACD signal on the 30-minute chart and a high RSI level in the overbought zone. The price was not ready to break through the key level of 1.08800 and consolidate for further testing of 1.08900.
The GBP/JPY is currently in a very promising position for continued growth. But I was not ready to hold the position for a long time, fearing the psychological aspect and the growth cancelling due to the approach to 70 RSI and the long term developing MACD divergence, which can be seen on the hourly chart. I opened a short-term position after several attempts to break through the 200.400 and MACD signal with a move to the positive value zone on the 15-minute chart. However, the important fact is that after breaking through the 2015 high key level at 196.00, GBP/JPY has not been at its current price level above the 200.00 mark since 2008.
recent trades May 28 (IedYE8) for.png
 
Top