Price, (Volume), Support, Resistance, Demand, Supply . . .

dc2000 said:
the position hasn't gone against them by 100 points they have sold into the market from the previous day and for most of the morning they are then buying back the positions in the afternoon for the next day you would see an early high that would be sold hard
Have they told you this themselves ?
 
Have they told you this themselves ?

I'll treat that statement with the contempt it deserves, clearly we have opposing views on how the chart should be read but then thats the market, feel free to prove me wrong I will be man enough to accept if I am
 
dc2000 said:
I'll treat that statement with the contempt it deserves, clearly we have opposing views on how the chart should be read but then thats the market, feel free to prove me wrong I will be man enough to accept if I am
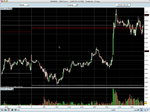
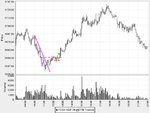
This chart does not show any background. It does not show any history. If it showed some history we would all know better the context in which the price action took placewithin the context of previous action. But there is no history and I have no idea what instrument it is either.

Now. we are presented with a chart showing a ragged bottom. The chart is a short timeframe chart, it is not a daily chart or a weekly chart. Therfore we have to take what we are given. And within the context of what we are given, and no more than we are given, it is evident a campaign has been carried out to accumulate.

Given that the campaign has been to accumulate and not to distribute, prices have been made to go UP after the campaign has been completed.The prices GOING UP and the reasons WHY, which I have explained in as much detail as is prudent in a public forum , within that context and relevant to the timeframe in which they are displayed only, the PROPENSITY is for prices to go even HIGHER as I have already explained and not to go LOWER.

Having said that, and if you refer to my earlier posts, you will read how it is that I also say the PROPENSITY is UP...but not immediately.

Now earlier...you make insinuations about HINDSIGHT and when I ask you ...you choose not to explain or justify your statements in reply to my post.

What is this HINDSIGHT of yours ? Or is it that you have a copy of the chart displayed with complete background information that you are deliberately hiding in an attempt to prove a point with me?


I AM SURE THAT FIREWALKER IS INTERESTED IN HAVING A DETAIL OF MARKET ACTION EXPLAINED TO HIM THAT BAFFLED HIM that no one ventured to explain properly to him in detail.


I asked you if they had told you themselves in the hope perhaps you would be able to substantiate the string of statements you have made, to give you a chance TO VERIFY your opinions WITH FACTS , and nothing else.

That's all.
 
Last edited by a moderator:
WOT did happen next!

Voila!
 

Attachments

  • WOTdidhappen NEXT!.jpg
    WOTdidhappen NEXT!.jpg
    121.7 KB · Views: 349
A very interesting analysis

SOCRATES said:
PROPENSITY is for prices to go even HIGHER as I have already explained and not to go LOWER.
Well Socrates I would agree with you. I enjoyed your analyses and scribbled them all over the chart. I think the area from about 13.00 to 15.00 hours in your analysis was particularly interesting

To be flippant for a moment the day seemed like a day in the mountains.

First we were up there on the hillside at 9.00, pushing our little showball over the lip of the mountain. Watching it roll down gathering more and more snow on the way, there it bounced at 11.00 and had just enough velocity to fall over the next precipice at 13.00. My that was a steep drop. It landed between 13.00 and 14.00 in huge mounds of snow. It scattered little snowballs everywhere and they were rolling up and down the little slopes sometimes gathering snow and sometimes losing a little, but all in all there was a mighty big heap of it in the end. We were all laughing so much at what was happening that we almost forgot lunch.

At about 15.00 the mood changed. Our party was beginning to get fed up with that game, so we decided to go up the mountains again. To begin with our sleigh ride was a bit bumpy - it was the cobbles you know ! We also had a few snowballs thrown at us where onlookers had found a few pockets of snow left, but we were losing interest in that game and in any case we had a heapful of snow on our sledge we had collected earlier. Later the ride was smoother, but we were beginning to get tired and activity levels dropped. It was getting towards late evening and we decided to take a respite on the plateau. Anyway tomorrow we are planning to continue up the mountain, probably on foot now until we get tired and reach the top. Then we're going to start the whole jolly ride again.

Back to the analysis

Velocity seems to fall into 3 phases between 15.00 and 22.00 i.e.
- 15.00 to 17.00 steep up
- 16.00 to 19.00 more shallow
- 20.00 to 22.00 horziontal

There appears to be a slowing down and also resistance at around 5708, which might suggest price will turn and drop. However, I am with you Socrates on a breakthrough. The reason is that there hasn't really been a distribution phase. Although higher volume is coming in from 15.30 to 17.30, it does not seem sensible to me that the previous accumulation, being difficult as you stated, would have suffcient time and be at the correct price level to suggest that distribution was substantially complete. In fact I don't think it has yet really started.

For this reason I too would expect it to shoot up the following day.

Charlton

As soon as I sent this I spotted the answer was posted by Rols, but I will leave my original posting untouched, apart from this editing remark
 
Charlton said:
To be flippant for a moment the day seemed like a day in the mountains.

First we were up there on the hillside at 9.00, pushing our little showball over the lip of the mountain. Watching it roll down gathering more and more snow on the way, there it bounced at 11.00 and had just enough velocity to fall over the next precipice at 13.00. My that was a steep drop. It landed between 13.00 and 14.00 in huge mounds of snow. It scattered little snowballs everywhere and they were rolling up and down the little slopes sometimes gathering snow and sometimes losing a little, but all in all there was a mighty big heap of it in the end. We were all laughing so much at what was happening that we almost forgot lunch.

At about 15.00 the mood changed. Our party was beginning to get fed up with that game, so we decided to go up the mountains again. To begin with our sleigh ride was a bit bumpy - it was the cobbles you know ! We also had a few snowballs thrown at us where onlookers had found a few pockets of snow left, but we were losing interest in that game and in any case we had a heapful of snow on our sledge we had collected earlier. Later the ride was smoother, but we were beginning to get tired and activity levels dropped. It was getting towards late evening and we decided to take a respite on the plateau. Anyway tomorrow we are planning to continue up the mountain, probably on foot now until we get tired and reach the top. Then we're going to start the whole jolly ride again.

For this reason I too would expect it to shoot up the following day.

Charlton

You been on the gluvine or absinthe?

:LOL:
 
what I referred to as hindsight my dear Soc is the fact that it is easy to explain a chart once everything has taken place would you have been able to do this as the market was unfolding say within first hour of trading

with regard to the chart I also do not know the instrument but I would has at a guess its either the Dax or the Ftse

My point was not to prove anything or show off but in your post you assume that the bears have turned bullish and not that the accumulation you speak of is distribution by the bears
 
dc2000 said:
what I referred to as hindsight my dear Soc is the fact that it is easy to explain a chart once everything has taken place would you have been able to do this as the market was unfolding say within first hour of trading

with regard to the chart I also do not know the instrument but I would has at a guess its either the Dax or the Ftse

My point was not to prove anything or show off but in your post you assume that the bears have turned bullish and not that the accumulation you speak of is distribution by the bears
Listen carefully, this time I would like you to pay attention for your own benefit and not resort to tit for tat argument for the sake of it......... I sometimes regret posting as invariably there are a handful of you who will persist in arguing with me from every angle imaginable........... This arguing for the sake of it is not a professional attitude to take, I will tell you here and now.

Let us take the first hour of trading.....what actually happened there ?

The price went sideways in a very narrow band...now look at the volume...OK ? ...why would a market that has just opened with overnight orders waiting to be executed behave like this ?
What is holding back the savvy traders from comitting ? The very low volume has got something to do with it...must have...why is the volume so low ? Because there is no significant participation FROM THE PEOPLE THAT MATTER.

The people that matter are not participating at the open, why ?

What transpires next ?

Prices suddenly are marked up..sharply...with some volume undrpinning the move...but that is all...the prices do not MOTOR...in fact...they come to a ceiling and stop dead...only to reverse sharply creating a TWEEZER TOP...I am explaning this only with price and volume in terms of basic technical analysis and nothing else because....illustrating it with price and volume ONLY is sufficient to illuminate the point.

Now prices fall away....what happens ?

The falling away attracts ACTIVITY....this activity is increasing ....so what would you have expected me to do...me personally (since you ask)...do you think I would have tried to contradict and be a clever boots and try to go long ? NO...the market is showing you falls...it is showing weakness...It is SCREAMING AT YOU it is not a market to be long in....IT IS HOWLING AT YOU LOUD to go short....as I am not hard of hearing...that is exactly what I would have done....and not closed my short position UNTIL I was satisfied the move was exhausted.

What is the first indication, the first clue, that the move is exhausted ?

Look at the chart...YES OF COURSE...the first bottom ! Yes...precisely !

Why ?

Because the move is stopped dead in its tracks with volume to accompany it.

At this juncture it does not matter what category of volume it is....what matters is that the move is stopped by SIGNIFICANT INTERVENTION.

This significant intervention could be ACCUMULATION PROPER or ACCUMULATION IMPROPER, meaning an element of STOPPING VOLUME.

I don't care what the insturment is, whart I do care about is that all of this is obvious.

Now does that answer your first question ?

Sometimes I wish I kept my mouth shut I tell you...because all of this gives me unnecessary work to have to explain and explain what is PATENTLY OBVIOUS.....as Podgy says....IT'S OBVIOUS ~ Its SCREAMINGAT YOU....IT REALLY IS !

The bears have not turned bullish...that is nonsense...sorry.

I have explained to you before that this is a CAMPAIGN to accumulate.

The process of accumulation in this example has been very messy...that is the reason for all the jumping up and down 4 times ...until ...it it ready to be taken UP.

When it does start to go UP (not down as you say) it displays characteristics of the direction hardening, of the response being in harmony with the direction...not against it as you IMPLY.

I Then went on to say it would go UP FURTHER...perhaps not immediately...BUT THAT IT WOULD GO UP....whereas you continued to contradict me WITHOUT FOUNDATION and insisted it would go DOWN.

It has not gone down....it has gone UP...as I envisaged...as shown in rol's chart.
THE BEARS YOU INSIST ON, HAVE NOTHING TO DO WITH IT,EXCEPT SOME OF THEM ARE BADLY SQUEEZED.....THE BEARS ARE OUT OF THE PICTURE.....THIS INSTRUMENT IS NOW CLEARLY IN BULL PHASE.

That's all.
 
dc2000 said:
what date was this rols

August 3rd I believe.

I recognised the chart pattern immediately....

......perhaps all the photo reading practise is paying off
 
so how would you have traded it?Soc

and perhapse if rols would be so kind as to expand the chart a little to show the next few days
 
dc2000 said:
so how would you have traded it?Soc

and perhapse if rols would be so kind as to expand the chart a little to show the next few days
Drop it will you ? Or are you trying to wind me up or what ?

Read my detailed explanation in my long post above where I clearly explain everything to you in detail including what I would have done and why and when, and all the reasons. Is that not enough for you ?
 
DAX Chart analysis

rols said:
August 3rd I believe.
I recognised the chart pattern immediately....

Cleary my chart has caught the attention of many traders out there. As this is dbphoenix' thread about PV,SR & DS and not about chart analysis or WOT, I'd like to suggest that any further investigation into this matter would be done into my journal where you can find daily charts of the -yes indeed rols & dc2000- DAX I am trying to understand and where there's plenty of room to go into detail.

Just for clearing things up, I attached the complete chart of the next day August 4rd. As you can see price initially skyrocketed but plummeted down about a 100 points to close near the low. The week after (from 7-11 Aug) buyers were only able to get price above 5700 for one short moment. For the greater part it moved around the 5635-5695 range with a low of 5575. Check my journal for the weekly and monthly chart.
 

Attachments

  • dax20060804end.GIF
    dax20060804end.GIF
    44.9 KB · Views: 289
Last edited:
dc2000 said:
so how would you have traded it?Soc
and perhapse if rols would be so kind as to expand the chart a little to show the next few days
SOCRATES said:
Drop it will you ? Or are you trying to wind me up or what ?

For me, personally, it's not about a person's view about what's going to happen next. I hope you guys are able to find some kind of consensus, because it never was my intention to evoke a "I was right, you were wrong" discussion. I'd like to thank everybody and especially Socrates for the time and effort spent in analyzing the chart.

Although there are a lot of arguments to be made in favour of, I'm still not clear as to why price dropped down on this particular chart, but went up further on another occasion where - in my view - everything looked exactly the same (even the potential SC point at 5637.50 where price reversed). Taking in account you had no sight on what happened the days before or any other indication of that matter, wouldn't any trader with a setup based around SC have the similar bias or read the same signals or am I missing something?

The only thing different is the distance price fell down. In the first chart, a mere 80 points, in the other one around 50. But as the dropdown on both occasions suddenly stopped at 5637.50 that price level must have meant something to buyers and sellers (indeed in hindsight that was already a S/R level). Of course it's not exact 5637.50 but you know what I mean.
 

Attachments

  • SC1.GIF
    SC1.GIF
    52.1 KB · Views: 250
  • scyes.jpg
    scyes.jpg
    48.6 KB · Views: 254
SOCRATES said:
Let us take the first hour of trading.....what actually happened there ?
The price went sideways in a very narrow band...now look at the volume...OK ? ...why would a market that has just opened with overnight orders waiting to be executed behave like this ?
What is holding back the savvy traders from comitting ? The very low volume has got something to do with it...must have...why is the volume so low ? Because there is no significant participation FROM THE PEOPLE THAT MATTER.
The people that matter are not participating at the open, why ?

You could not have known this Socrates, but as this is the DAX which opens one hour before all the other European exchanges. It also stays open much longer (until 2200 instead of 1730 which is why volume is dropping off after that point). This does not imply that volume has to be low on these early or lately hours - as I've seen several occassions where there definitely still was some active trading going on - but usually it is a lot lower than the average.
 
firewalker99 said:
Although there are a lot of arguments to be made in favour of, I'm still not clear as to why price dropped down on this particular chart, but went up further on another occasion where - in my view - everything looked exactly the same (even the potential SC point at 5637.50 where price reversed). Taking in account you had no sight on what happened the days before or any other indication of that matter, wouldn't any trader with a setup based around SC have the similar bias or read the same signals or am I missing something?

Which is the difference between hindsight analysis and real-time trading. It doesn't matter why price went down or why it rallied or what it will do in twenty minutes or two hours or the next day. What matters is what, if anything, one will do with what is in front of him. None of the hindsight analysts can tell you that because none of them know.

There are dozens of HAs in this thread and elsewhere. Many of them are mine. Adding one more to the pile does no special harm. But it does encourage beginners to this to focus on what each individual bar "means" and on somehow predicting what will happen throughout the future, thus preventing them from ever learning how to trade in real time (or trying to trade in RT using what they think they've learned and more often than not losing whatever they've bet on the trade).

This is not "my" thread, not after so many hundreds of posts. I had hoped that by now some effort would be made to go beyond the hypothetical and the theoretical and the hindsight "this is what I would have done", but clearly that is not going to happen since the siren song of effortless trading is so strong. Therefore, I'll work on the S/R thread and leave this one to those who focus on the future rather than the present. They have my best wishes.

Db
 
firewalker99 said:
You could not have known this Socrates, but as this is the DAX which opens one hour before all the other European exchanges. It also stays open much longer (until 2200 instead of 1730 which is why volume is dropping off after that point). This does not imply that volume has to be low on these early or lately hours - as I've seen several occassions where there definitely still was some active trading going on - but usually it is a lot lower than the average.
AAAh ! Thata explains it then...thank you.
 
dbphoenix said:
I've lost count of how many times I've said this, but the reason that you were "unable to comprehend why this happened" or why you weren't "able to do anything about it" is that you haven't put in the time and effort to come up with a setup that you have tested thoroughly enough to determine its probability of success. What to you is a setup is in fact no more than what to you seems like a good idea. And since you have no setup, your trading plan is largely wishful thinking. That you roll snake eyes so often should not come as a surprise.

Trading intuitively may come to you eventually, or it may never come to you. But you needn't trade intuitively in order to be consistently profitable. You can instead elect to do the work like nearly everybody else and develop your competence step by step. So, you have to decide whether you want to devote an undetermined amount of time learning to trade intuitively (which will likely entail finding a mentor or coach), or do you want to start making money?

Db

My first target is -or was- trying to understand why price moves in the way it does. I'm not sure if it's still worth pursuing in that way that perhaps I'm trying too hard at comprehending every move price makes. The second target was trying to base a strategy on the "acquired knowledge and ability to read the market". The third target was indeed to start making money, but not after I fully understood what was going on.

Now about my question on the two charts been talked about so much. I didn't say this was a situation I would build a plan or setup around. The only thing I was inquiring was why you stated "there is a relatively safe entry with a tight stop which you could make even if you didn't incorporate volume". For that reason only, I posted a similar chart where price did go against you. Let's put it this way: would you see any signals on the second chart (that would indicate this is not a relatively safe entry) that you could not distinguish on the first chart?
 
Top